
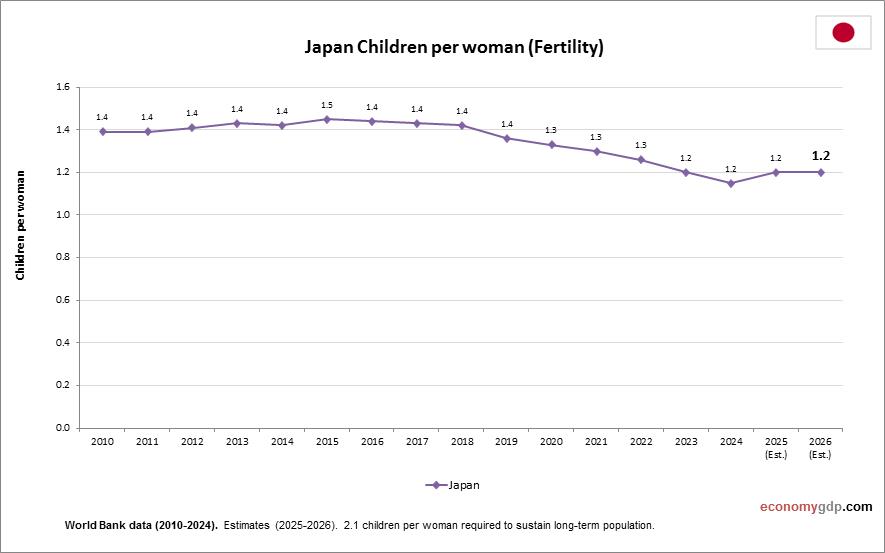
This diagram presents Japan Children Per woman. This is according to World Bank birth stats by country. Latest births per woman information for Japan.
Japan has one of the lowest children per woman rates globally. An aging society, economic pressures, career-focused lifestyles, and delayed marriage have led to a significant population decline.
Japan Children Per woman (Fertility Rate) Statistics by Year
| Year | Children per woman (fertility rate) |
| 2000 | 1.36 |
| 2001 | 1.33 |
| 2002 | 1.32 |
| 2003 | 1.29 |
| 2004 | 1.29 |
| 2005 | 1.26 |
| 2006 | 1.32 |
| 2007 | 1.34 |
| 2008 | 1.37 |
| 2009 | 1.37 |
| 2010 | 1.39 |
| 2011 | 1.39 |
| 2012 | 1.41 |
| 2013 | 1.43 |
| 2014 | 1.42 |
| 2015 | 1.45 |
| 2016 | 1.44 |
| 2017 | 1.43 |
| 2018 | 1.42 |
| 2019 | 1.36 |
| 2020 | 1.33 |
| 2021 | 1.30 |
| 2022 | 1.26 |
| 2023 | 1.20 |
| 2024 | 1.15 |
| 2025 (Est.) | 1.20 |
| 2026 (Est.) | 1.20 |