Skip to content
cropped-economygdp.jpg

Economy GDP

World economy charts, business frameworks and diagrams

Menu

Primary menu

  • Economy
    • Top Economies
  • Demographics
  • Business
    • Strategy
    • Project Management
    • Industry Examples
    • Leadership
    • HR
    • Industry Examples
  • Framework
  • Analysis
  • Lean Six Sigma
    • Lean
  • IT
    • Social Media
  • Marketing
  • Stories
  • Top

Tag Archives: Japan statistics

Japan Fertility Rate

Japan Fertility Rate

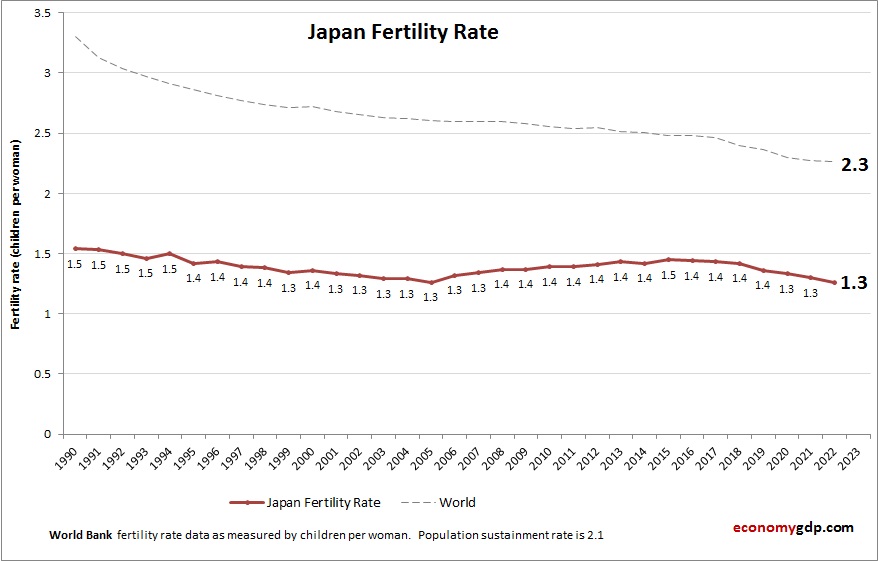
The above graph shows Japan Fertility Rate. The fertility rate statistics are compiled by World Bank. Based on the latest demographics info provided for Japan. Japan’s fertility rate is very low, well below replacement level, driven by economic pressures, changing View diagram Japan Fertility Rate→

Posted in Demographics | Tagged Japan demographics, Japan statistics

Japan GDP Purchasing Power Parity

Japan GDP Purchasing Power Parity

Japan economy graph showing purchasing power parity (PPP) growth from 2000 to today. Purchasing power parity adjusts the size of the economy to relevant price levels, i.e. measuring the price of specific goods in different countries and adjusting GDP accordingly. View diagram Japan GDP Purchasing Power Parity→

Posted in Economy | Tagged Japan, Japan economy, Japan gdp, Japan statistics

Primary Sidebar Widget Area

Top Diagrams

Latest Posts

  • Malaysia Children Per woman
  • Greece Inflation
  • Dominican Republic Fertility Rate
  • Montenegro Children Per woman
  • Tanzania GDP PPP
  • Tunisia GDP PPP
  • Kosovo GDP
  • Process Improvement Project
  • Mali GDP Purchasing Power Parity
  • Four Data Analysis Techniques
  • Honduras Economy
  • Fiji Fertility Rate
  • Sri Lanka GDP
  • Greece Economy
  • Slovenia GDP PPP
  • Twitter
Copyright © 2026 Economy GDP. All Rights Reserved.
Theme: Catch Box by Catch Themes
Scroll Up