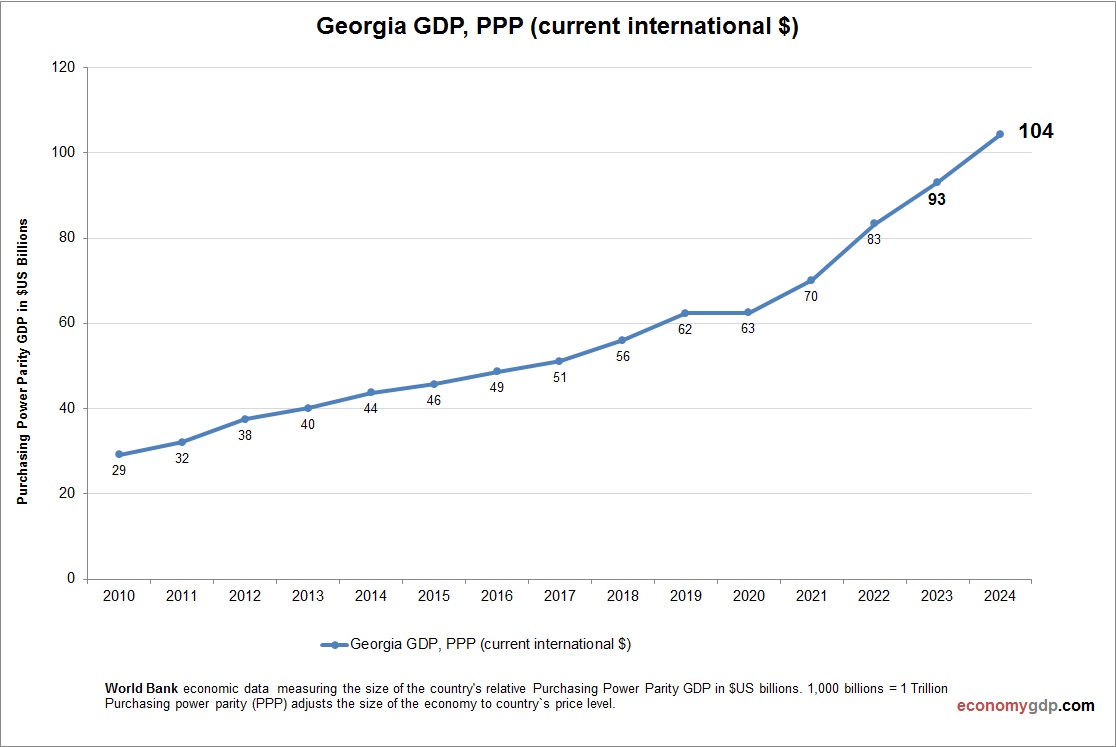
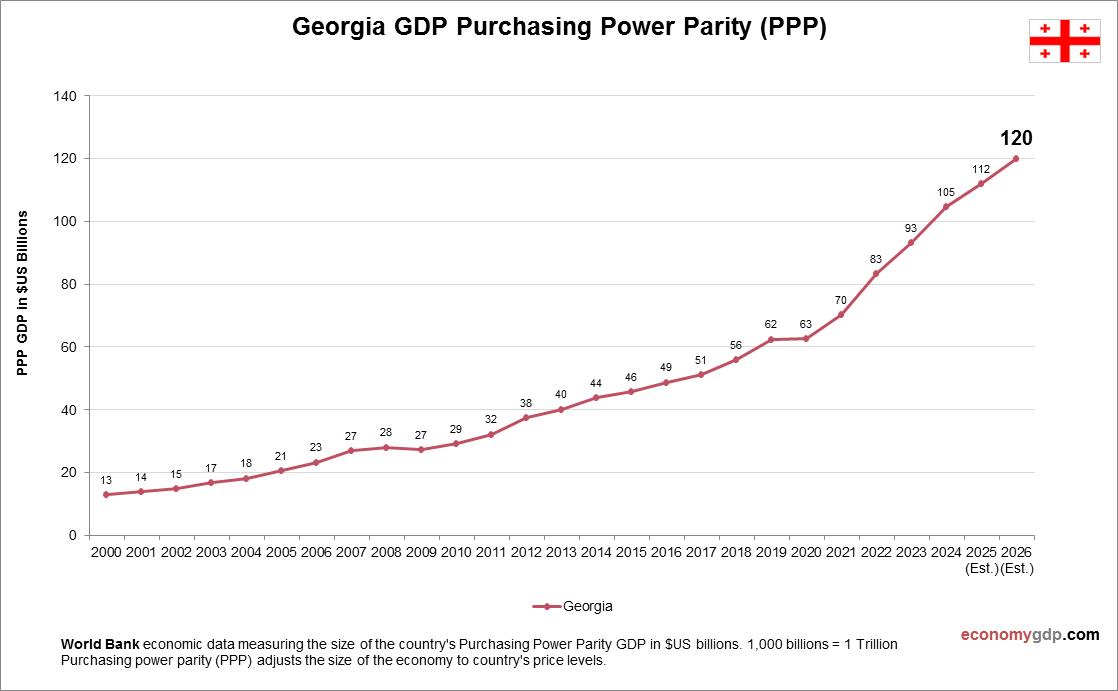
Skip to content
cropped-economygdp.jpg

Economy GDP

World economy charts, business frameworks and diagrams

Menu

Primary menu

  • Economy
    • Top Economies
  • Demographics
  • Business
    • Strategy
    • Project Management
    • Industry Examples
    • Leadership
    • HR
    • Industry Examples
  • Framework
  • Analysis
  • Lean Six Sigma
    • Lean
  • IT
    • Social Media
  • Marketing
  • Stories
  • Top

Tag Archives: Georgia statistics

Georgia GDP Purchasing Power Parity

Georgia GDP Purchasing Power Parity

Georgia’s GDP (PPP) is projected at $81.8 billion in 2025. Georgia’s economy relies on agriculture (wine, citrus), tourism, and hydropower exports. The PPP adjustment boosts GDP due to a low cost of living. Reforms and a business-friendly environment attract investment, View diagram Georgia GDP Purchasing Power Parity→

Posted in Economy | Tagged Georgia, Georgia economy, Georgia GDP, Georgia statistics

Georgia Children Per woman

Georgia Children Per woman

The above graph shows Georgia Children Per woman. The fertility rate statistics are compiled by World Bank. Latest births per woman information for Georgia. Georgia’s children per woman rate is low. Economic migration, an aging population, and shifting family priorities View diagram Georgia Children Per woman→

Posted in Demographics | Tagged Georgia demographics, Georgia statistics

Primary Sidebar Widget Area

Top Diagrams

Latest Posts

  • North Korea Economy in Graphs
  • New Zealand Economy in Graphs
  • Mozambique Economy in Graphs
  • Morocco Economy in Graphs
  • Mongolia Economy in Graphs
  • Mali Economy in Graphs
  • Malaysia Economy in Graphs
  • Luxembourg Economy in Graphs
  • Lithuania Economy in Graphs
  • Libya Economy in Graphs
  • Liberia Economy in Graphs
  • Kyrgyzstan Economy in Graphs
  • Kuwait Economy in Graphs
  • Jordan Economy in Graphs
  • Iraq Economy in Graphs
  • Twitter
Copyright © 2026 Economy GDP. All Rights Reserved.
Theme: Catch Box by Catch Themes
Scroll Up