
Georgias PPP GDP was $81.8 billion in 2023. Tourism, agriculture, and hydropower drive growth, with GDP per capita (PPP) at $22,100. Pro-business reforms and EU ties support prospects, but regional tensions and infrastructure gaps pose challenges for sustained growth.
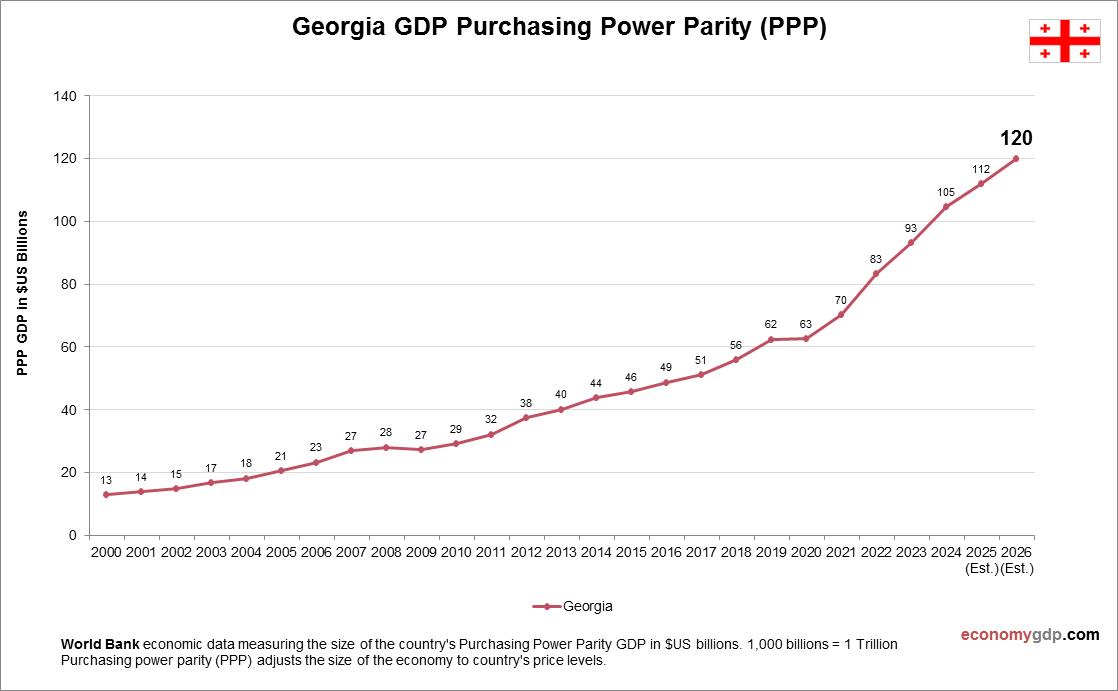
Georgia GDP PPP Statistics by Year
| Year | GDP, Purchasing Power Parity (PPP) |
| 2000 | 12.9 |
| 2001 | 13.8 |
| 2002 | 14.8 |
| 2003 | 16.8 |
| 2004 | 18.2 |
| 2005 | 20.6 |
| 2006 | 23.2 |
| 2007 | 26.8 |
| 2008 | 28.0 |
| 2009 | 27.2 |
| 2010 | 29.2 |
| 2011 | 32.2 |
| 2012 | 37.5 |
| 2013 | 40.1 |
| 2014 | 43.8 |
| 2015 | 45.7 |
| 2016 | 48.7 |
| 2017 | 51.1 |
| 2018 | 56.0 |
| 2019 | 62.4 |
| 2020 | 62.5 |
| 2021 | 70.2 |
| 2022 | 83.4 |
| 2023 | 93.2 |
| 2024 | 104.6 |
| 2025 (Est.) | 112.0 |
| 2026 (Est.) | 120.0 |