Liberia Inflation

Liberia Inflation

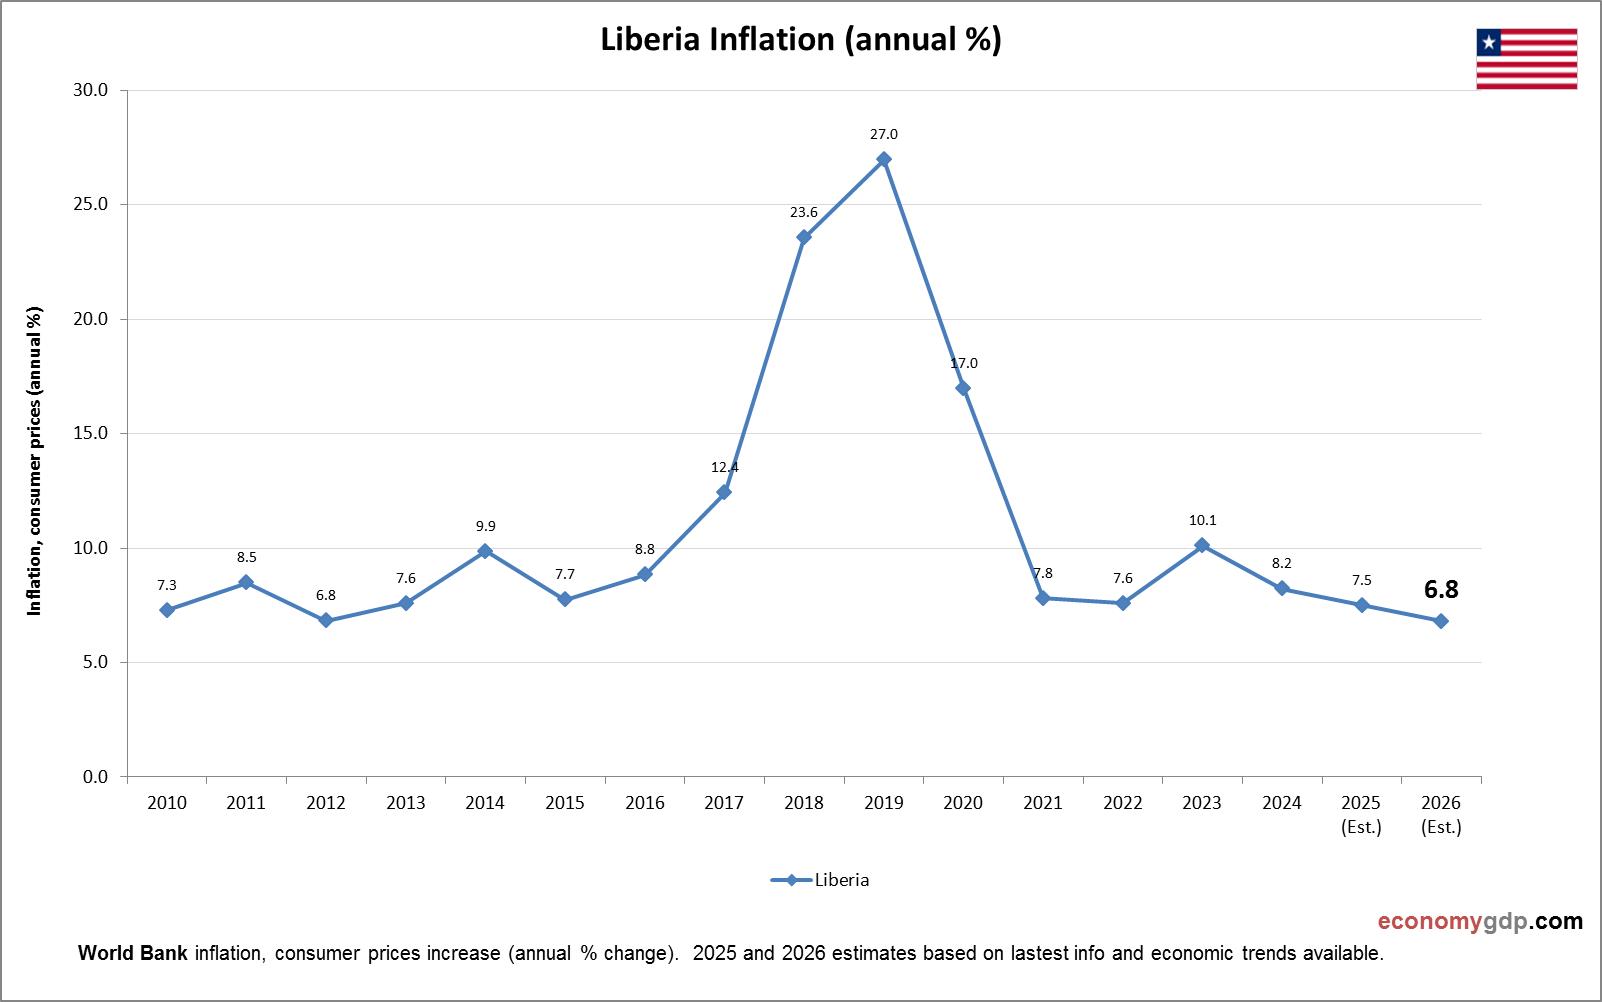
This chart demonstrates Liberia Inflation. The consumer price statistics are compiled by World Bank. Based on the latest economic data provided for Liberia. Liberia experiences inflation due to food and fuel import dependency, currency instability, and weak infrastructure for local View diagram Liberia Inflation→

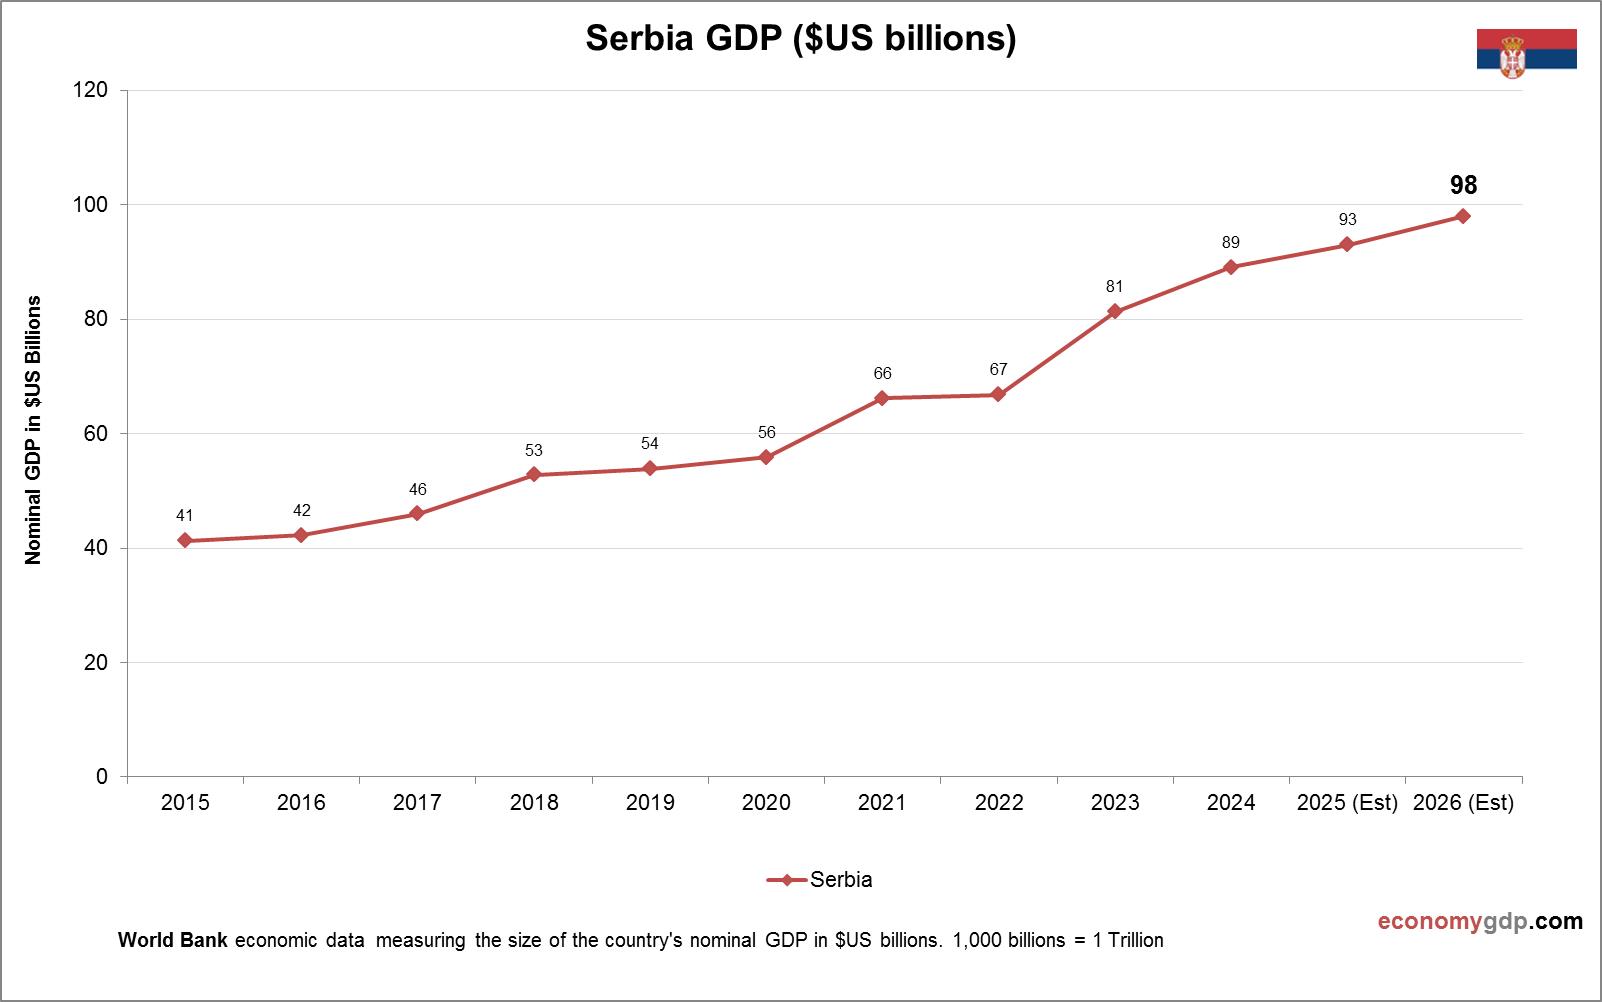
Serbia GDP

Serbia GDP

Serbia's transitional economy, reaching $90 billion in 2025, grows at 3.0%, driven by manufacturing, agriculture, and EU-oriented exports like vehicles and fruits. Per capita income nears $13,000. Corruption and 9% unemployment hinder progress, but FDI in renewables and tourism fuels View diagram Serbia GDP→

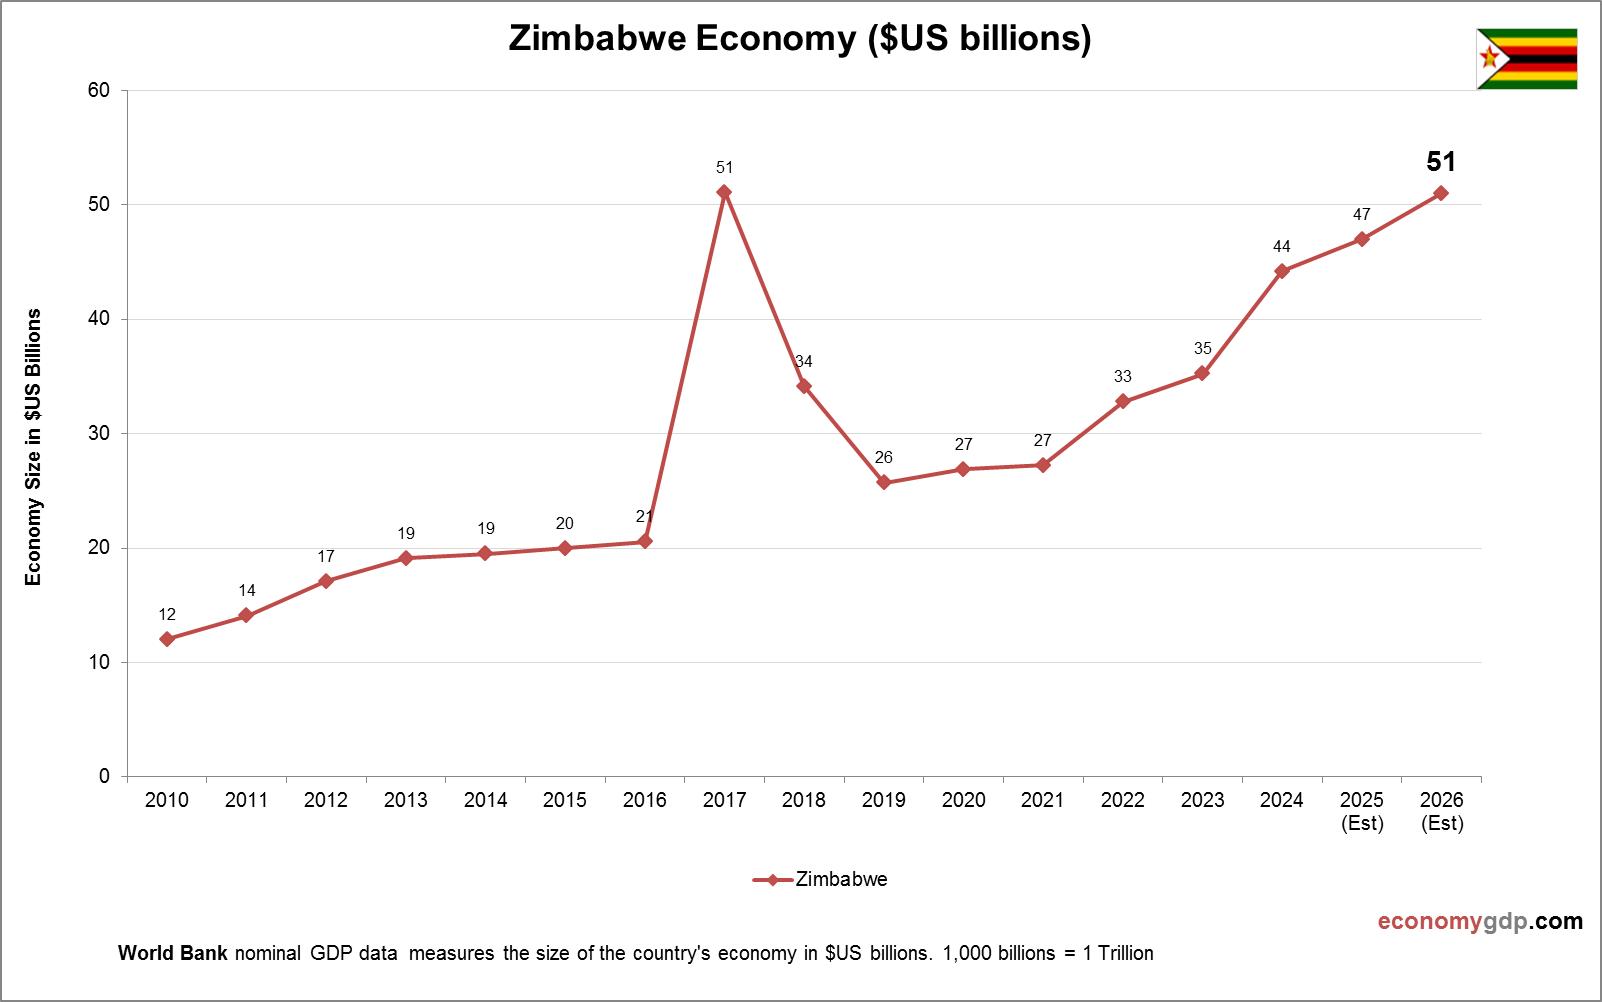
Zimbabwe Economy in Graphs

Zimbabwe Economy in Graphs

Zimbabwe’s economy, worth $25 billion, relies on agriculture, which employs 60% of the workforce, producing tobacco and cotton. Mining, particularly gold and platinum, drives 60% of exports. Tourism, tied to Victoria Falls, and remittances are significant. Emerging sectors include lithium View diagram Zimbabwe Economy in Graphs→

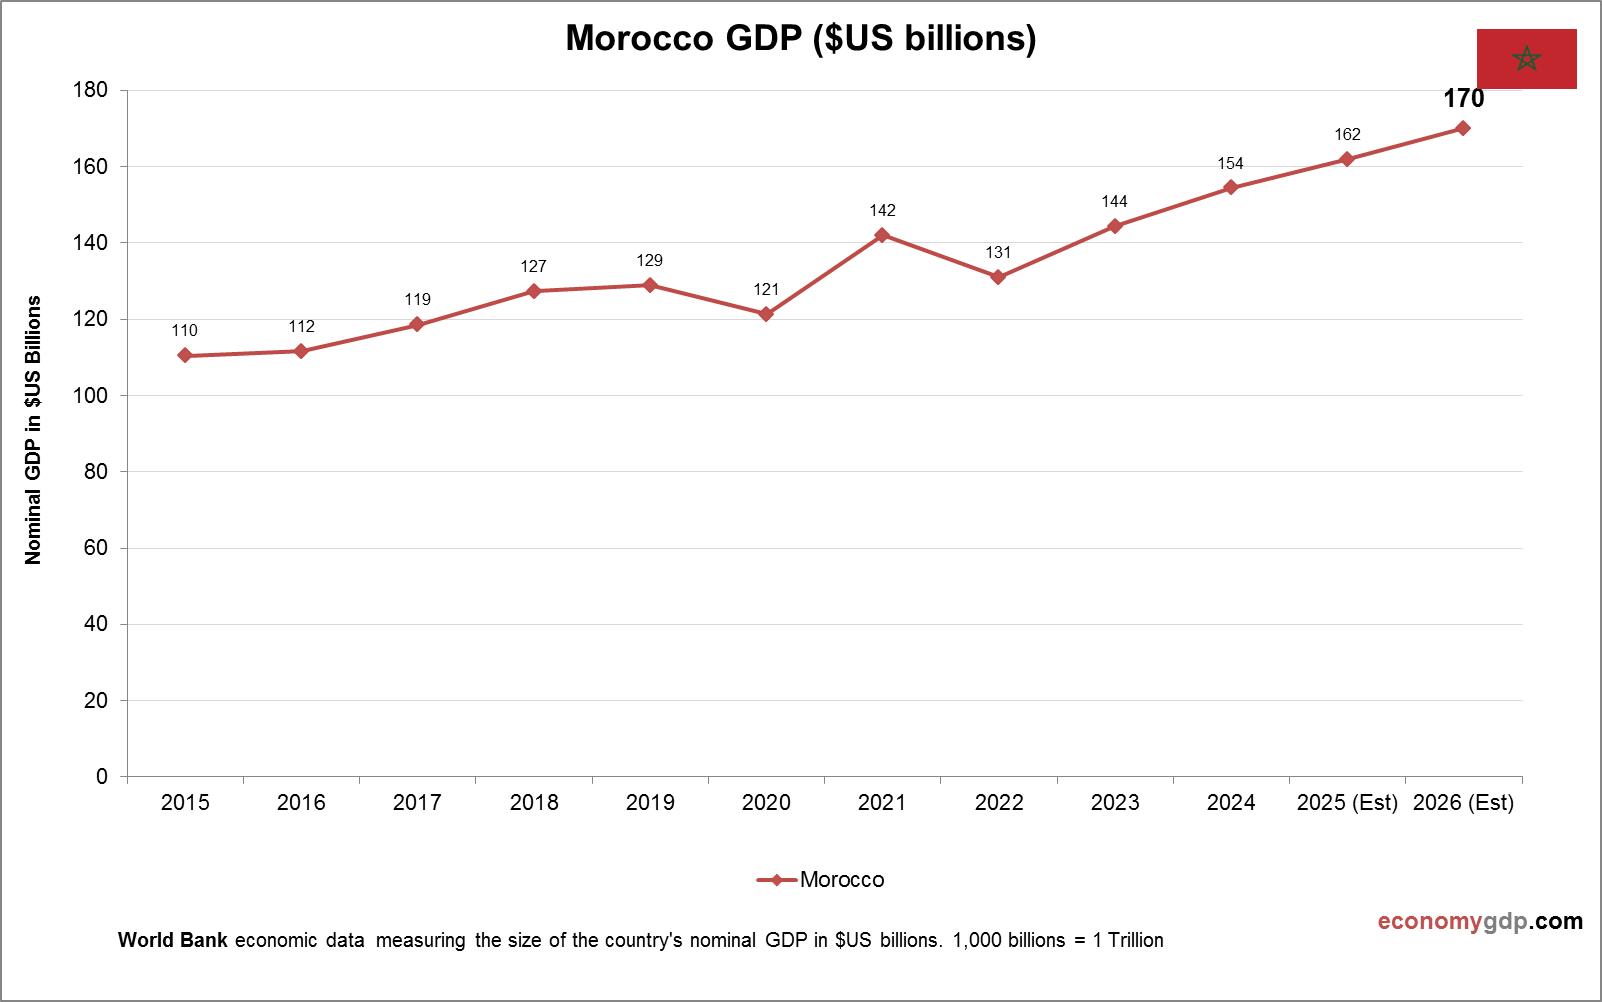
Morocco GDP

Morocco GDP

Morocco's economy blends agriculture, manufacturing, and services, with tourism and phosphates playing central roles. It is one of the world's largest phosphate exporters, while modern sectors like automotive, aerospace, and renewable energy are growing rapidly. Agriculture contributes significantly, though it View diagram Morocco GDP→

Business Model Canvas Templates

Business Model Canvas Templates

Business Model Canvas Templates: Business model canvas templates are pre-designed frameworks that help organizations map out their business model. These templates typically include key elements like customer segments, value propositions, revenue streams, channels, and key partnerships. By using a template, View diagram Business Model Canvas Templates→

Israel Inflation

Israel Inflation

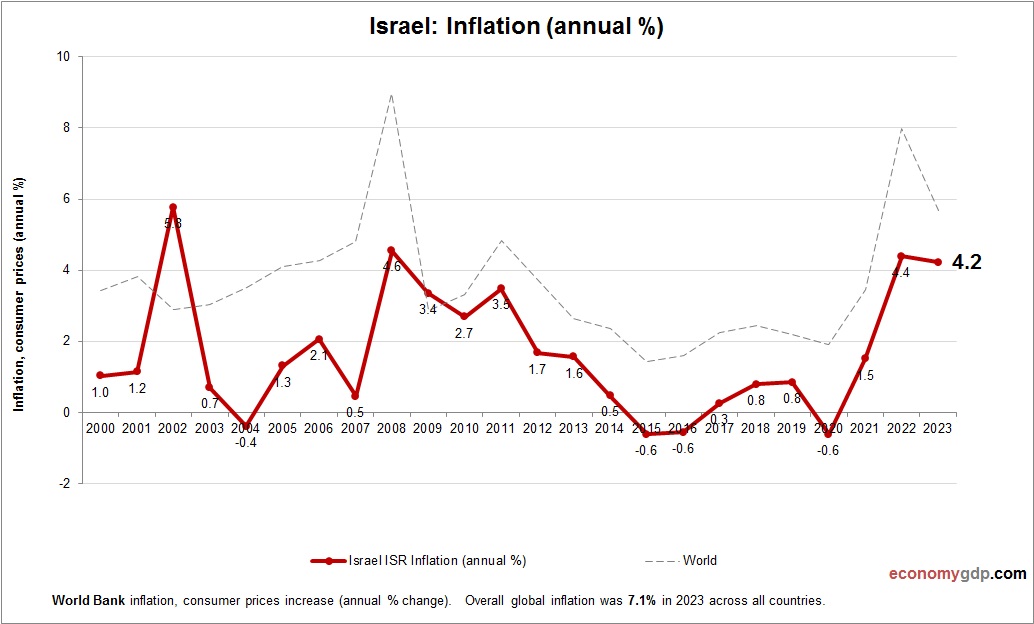
This graph shows Israel Inflation. Inflation data is sourced from World Bank. Based on the latest available information for Israel. Israel’s inflation is influenced by housing prices, wage growth, and imported energy costs, with monetary tightening helping to contain price View diagram Israel Inflation→