Song Dynasty China: First Government Paper Currency
China's Song Dynasty (11th century) introduced the first government-backed paper currency, known as ‘jiaozi.’

World economy charts, business frameworks and diagrams
China's Song Dynasty (11th century) introduced the first government-backed paper currency, known as ‘jiaozi.’
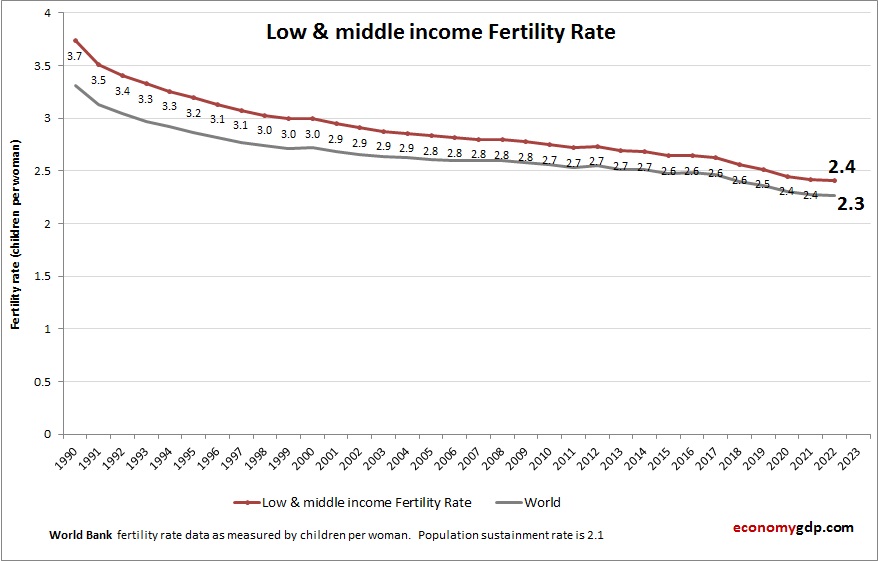
Chart above demonstrates Low & middle income Fertility Rate. The fertility rate statistics are compiled by World Bank. Based on the latest demographics info provided for Low & middle income. Fertility rates in low- and middle-income countries are diverse but View diagram Low & middle income Fertility Rate
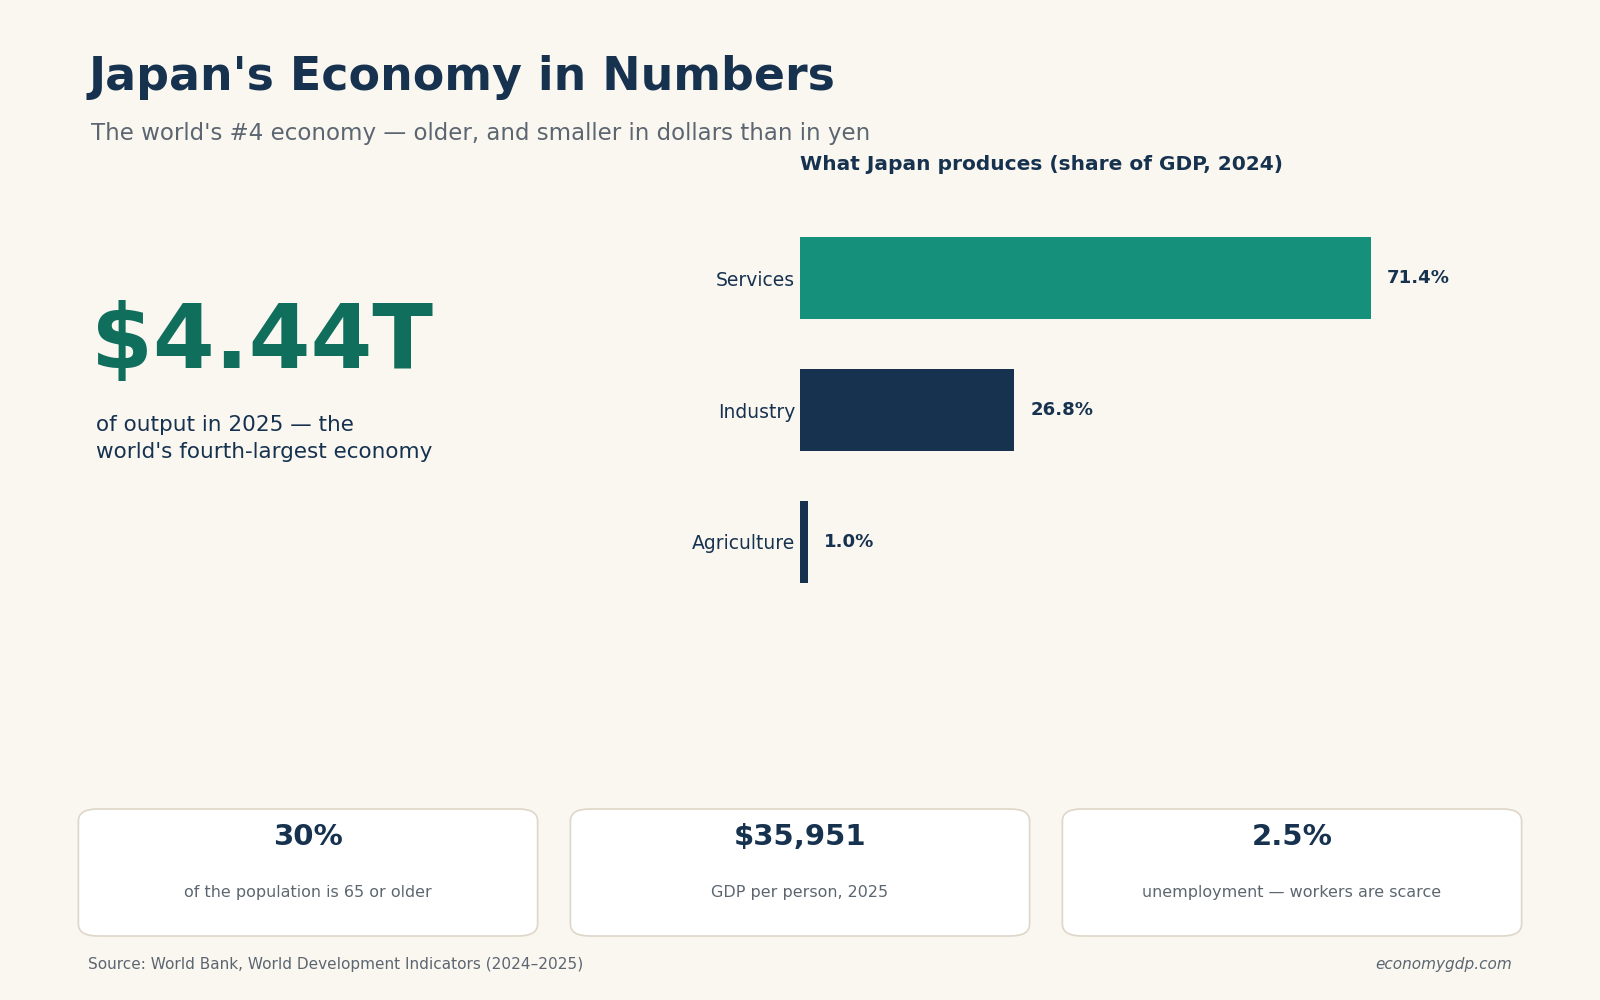
Japan is the world’s fourth-largest economy, and also one of its strangest. It produces about $4.44 trillion of output a year — more than the UK, more than India — yet ask a Japanese person how the economy feels and View diagram Japan’s Economy, Explained

This diagram presents Sweden Inflation. This is according to World Bank consumer price index stats by country. Based on the latest economic data provided for Sweden. Swedens inflation is influenced by rising energy costs, supply chain disruptions, and labor market View diagram Sweden Inflation

Comoros' $1.3 billion economy, growing 3.5% in 2025, depends on vanilla, cloves, and emerging tourism, with per capita GDP at $1,600. Spice exports thrive, but fuel imports strain trade for its 900,000 residents. Poverty (45%) and weak infrastructure pose challenges. View diagram Comoros GDP

Every big economy has a personality. America’s is the consumer, China’s is the factory. India’s is momentum. At $3.96 trillion it’s the world’s sixth-largest economy, and in 2025 it grew 7.6% — faster than any other major economy, the same View diagram India’s Economy, Explained

China is the world’s second-largest economy at $19.5 trillion — about 63% the size of the United States, and nearly four times Germany, the number three. For forty years its rise was the biggest story in the world economy. The View diagram China’s Economy, Explained
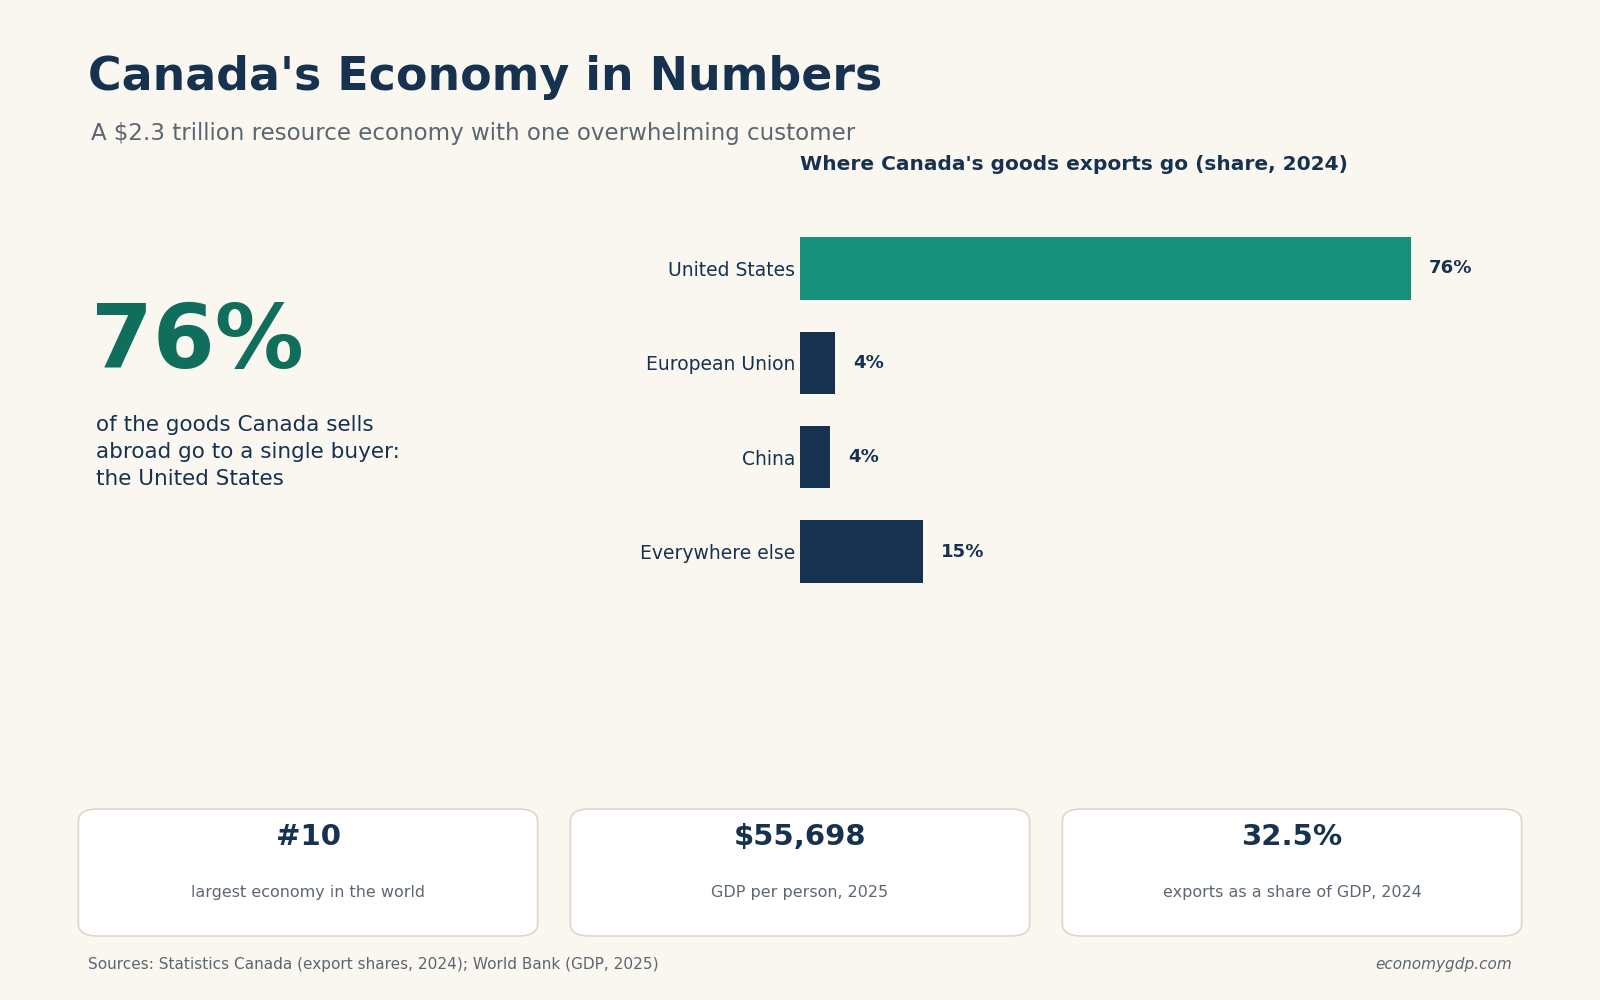
Canada is the world’s tenth-largest economy: about $2.3 trillion of output a year, $55,700 per person, 41.7 million people. On paper it looks like a smaller, calmer version of its southern neighbour. Underneath, it’s a very different machine — one View diagram Canada’s Economy, Explained
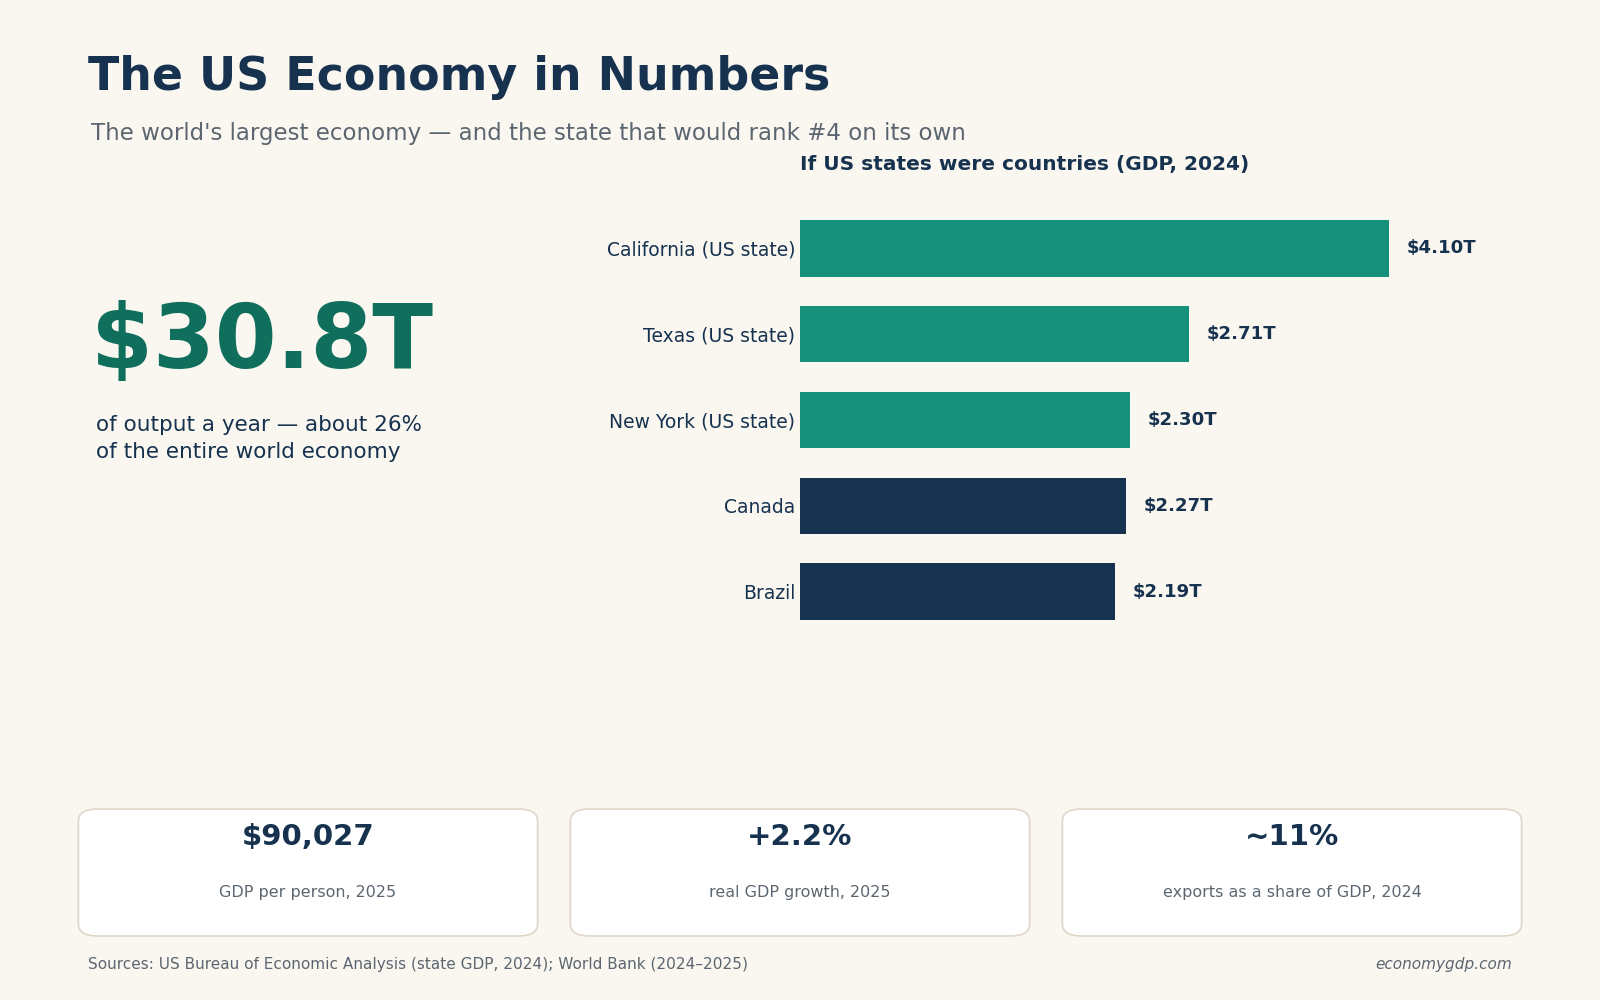
Start with the scale, because the scale is the story. The United States produces about $30.8 trillion of output a year — roughly 26 cents of every dollar earned on Earth, from a country holding about 4% of the world’s View diagram The US Economy, Explained

The world economy churns out about $118 trillion worth of goods and services a year. Here’s the part that surprises people: a small club of ten countries produces roughly $78.5 trillion of that — two out of every three dollars View diagram The World’s Largest Economies Right Now