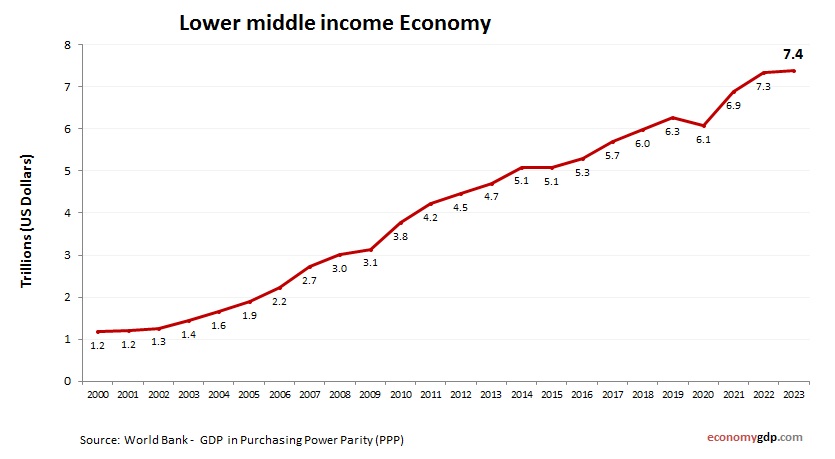
Lower middle income Economy
Lower middle income economy growth from 2000 to today. GDP (current US$). World Bank and OECD national accounts data. Lower-middle-income economies are in transition from subsistence agriculture to industrialization. Their GDPs grow through labor-intensive manufacturing, services, and increasing regional trade.
West Bank and Gaza GDP growth rate
West Bank and Gaza economy growth rate from 2000 to today. GDP growth (annual %). World Bank and OECD national accounts data. The economy in the West Bank and Gaza faces significant challenges due to political instability and restrictions, with View diagram West Bank and Gaza GDP growth rate
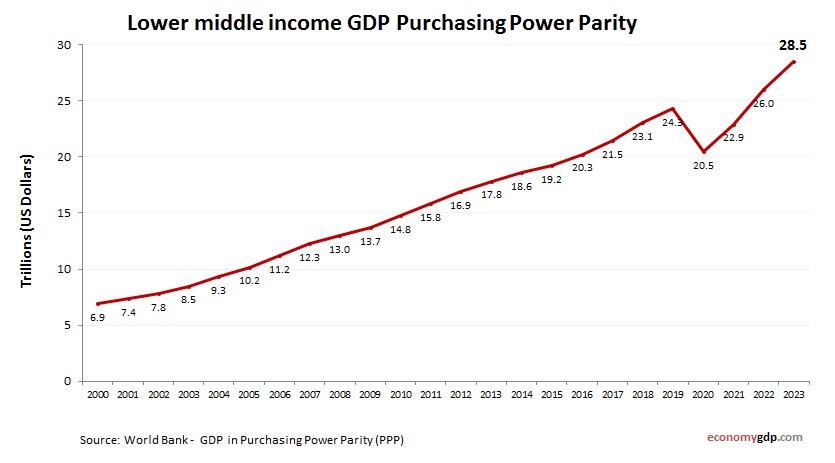
Lower middle income GDP Purchasing Power Parity
Lower middle income economy graph showing purchasing power parity (PPP) growth from 2000 to today. Purchasing power parity adjusts the size of the economy to relevant price levels, i.e. measuring the price of specific goods in different countries and adjusting View diagram Lower middle income GDP Purchasing Power Parity
Kazakhstan GDP Purchasing Power Parity
Kazakhstan economy graph showing purchasing power parity (PPP) growth from 2000 to today. Purchasing power parity adjusts the size of the economy to relevant price levels, i.e. measuring the price of specific goods in different countries and adjusting GDP accordingly. View diagram Kazakhstan GDP Purchasing Power Parity
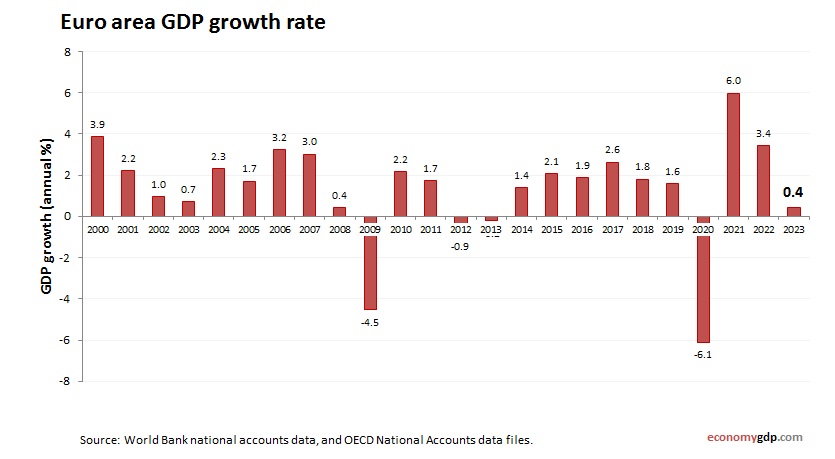
Euro area GDP growth rate
Euro area economy annual growth rate from 2000 to today. GDP growth (yearly %). World Bank and OECD national accounts data. The Euro area experienced a GDP growth rate of 0.45% in 2023. The region faced stagnation, with zero growth View diagram Euro area GDP growth rate
East Asia and Pacific GDP PPP
East Asia and Pacific economy graph showing purchasing power parity (PPP) growth from 1990 to today. Purchasing power parity adjusts the size of the economy to relevant price levels, i.e. measuring the price of specific goods in different countries and View diagram East Asia and Pacific GDP PPP
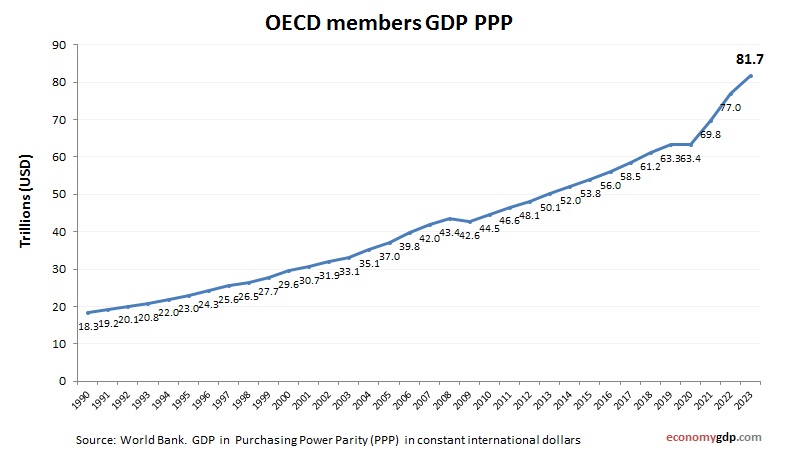
OECD members GDP PPP
OECD members economy graph showing purchasing power parity (PPP) growth from 1990 to today. Purchasing power parity adjusts the size of the economy to relevant price levels, i.e. measuring the price of specific goods in different countries and adjusting GDP View diagram OECD members GDP PPP
Germany GDP PPP
Germany economy graph showing purchasing power parity (PPP) growth from 1990 to today. Purchasing power parity adjusts the size of the economy to relevant price levels, i.e. measuring the price of specific goods in different countries and adjusting GDP accordingly. View diagram Germany GDP PPP
Russia GDP growth rate
Russia economy annual growth rate from 2000 to today. GDP growth (yearly %). World Bank and OECD national accounts data. Russia’s GDP grew by 3.6% in 2023. The country showed surprising resilience amid international sanctions, supported by domestic demand and View diagram Russia GDP growth rate