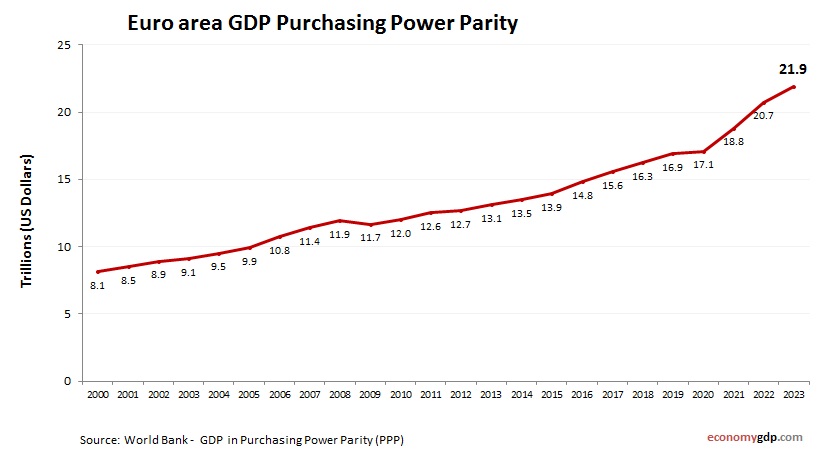
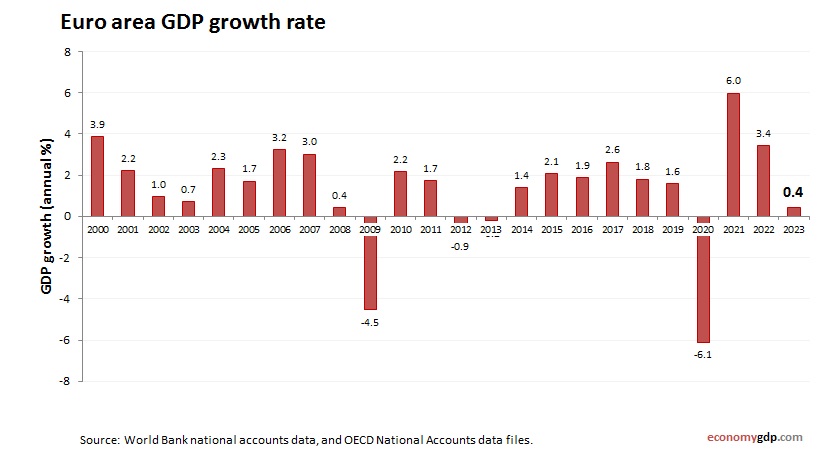
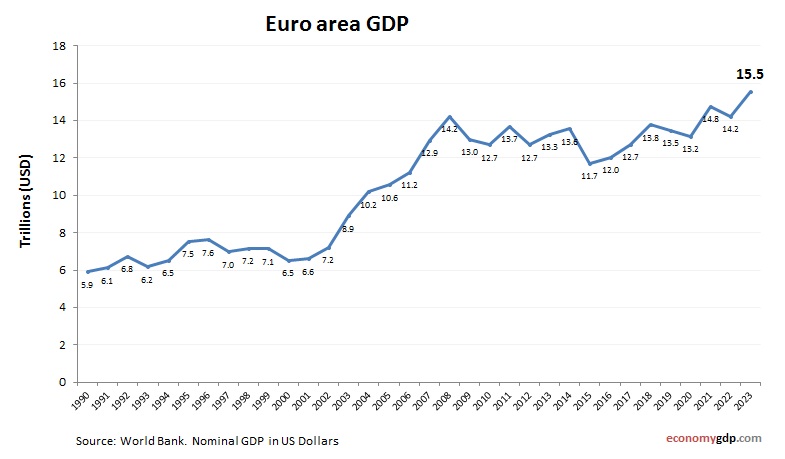
Skip to content
cropped-economygdp.jpg

Economy GDP

World economy charts, business frameworks and diagrams

Menu

Primary menu

  • Economy
  • Demographics
  • Business
    • Strategy
    • Project Management
    • Industry Examples
    • Leadership
    • HR
    • Industry Examples
  • Framework
  • Analysis
  • Lean Six Sigma
    • Lean
  • IT
    • Social Media
  • Marketing
  • Top

Tag Archives: Euro area gdp

Euro area GDP

Euro area GDP

Euro area GDP from 1990 to today. World Bank and OECD data. GDP in US dollars. The GDP of the Euro area aggregates economic output from all euro-using EU members. This high-income bloc benefits from economic integration, coordinated policy, and View diagram Euro area GDP→

Posted in Economy | Tagged Euro area economy, Euro area gdp, Euro area gdp graph, Euro area gdp nominal

Euro area GDP Purchasing Power Parity

Euro area GDP Purchasing Power Parity

Euro area economy graph showing purchasing power parity (PPP) growth from 2000 to today. Purchasing power parity adjusts the size of the economy to relevant price levels, i.e. measuring the price of specific goods in different countries and adjusting GDP View diagram Euro area GDP Purchasing Power Parity→

Posted in Economy | Tagged Euro area economy, Euro area economy graph, Euro area gdp, Euro area gdp ppp, Euro area gdp purchasing power parity

Euro area Economy

Euro area Economy

Euro area economy growth from 2000 to today. GDP (current US$). World Bank and OECD national accounts data. The Euro area consists of EU countries that use the euro, forming a high-income, advanced economic zone. Its GDP is fueled by View diagram Euro area Economy→

Posted in Economy | Tagged Euro area economy, Euro area gdp, Euro area gdp graph, Euro area gdp nominal

Euro area GDP PPP

Euro area GDP PPP

Euro area economy graph showing purchasing power parity (PPP) growth from 1990 to today. Purchasing power parity adjusts the size of the economy to relevant price levels, i.e. measuring the price of specific goods in different countries and adjusting GDP View diagram Euro area GDP PPP→

Posted in Economy | Tagged Euro area economy, Euro area economy graph, Euro area gdp, Euro area gdp ppp, Euro area gdp purchasing power parity

Euro area GDP growth rate

Euro area GDP growth rate

Euro area economy annual growth rate from 2000 to today. GDP growth (yearly %). World Bank and OECD national accounts data. The Euro area experienced a GDP growth rate of 0.45% in 2023. The region faced stagnation, with zero growth View diagram Euro area GDP growth rate→

Posted in Economy | Tagged Euro area, Euro area economy, Euro area gdp, Euro area gdp growth, Euro area gdp increase

Primary Sidebar Widget Area

Top Diagrams

Latest Posts

  • Saudi Arabia GDP per capita
  • Fraud Risk Framework Definition
  • Fertility Rate
  • Mali Fertility Rate
  • Isle of Man Children Per woman
  • Teacher Time Management Tips
  • Business Model Wheels
  • St. Kitts and Nevis GDP per capita
  • Romania GDP per capita
  • Namibia GDP per capita
  • Senegal Children Per woman
  • Example Feedback Template
  • New Zealand Inflation
  • Solomon Islands GDP per capita
  • Bulgaria Children Per woman

Top Tags

  • business strategy (30)
  • marketing strategy (25)
  • digital strategy (24)
  • IT strategy (24)
  • IT strategy framework (21)
  • digital strategy framework (20)
  • digital framework (19)
  • it framework (19)
  • technology strategy (19)
  • business model (18)
  • risk management (18)
  • marketing framework (17)
  • change management (16)
  • change management diagram (16)
  • change management framework (16)
  • leadership diagram (16)
  • marketing diagram (16)
  • business model framework (15)
  • data analysis (15)
  • data analysis diagram (15)

Categories

  • Analysis
  • Business
  • Demographics
  • Economy
  • Finance
  • Framework
  • Functional
  • HR
  • Industry Examples
  • IT
  • Leadership
  • Lean
  • Lean Six Sigma
  • Marketing
  • Professional Development
  • Project Management
  • Risk Management
  • Social Media
  • Strategy
  • Top
  • Twitter
Copyright © 2025 Economy GDP. All Rights Reserved.
Theme: Catch Box by Catch Themes
Scroll Up