Denmark Economy
Denmark's economy is highly advanced and innovation-driven, supported by a strong welfare model, high productivity, and a competitive business environment. Key industries include pharmaceuticals, wind energy technology, machinery, food processing, and maritime shipping. Denmark is a global leader in renewable View diagram Denmark Economy
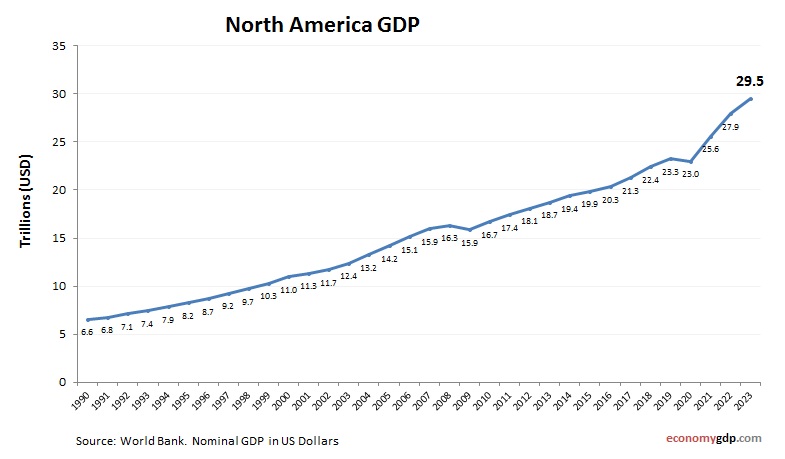
North America GDP
North America GDP from 2010 to today. World Bank and OECD data. GDP in US dollars. North America's $32 trillion economy, growing 2.0% in 2025, is led by U.S. technology and Canada's resources, with Mexico's manufacturing rising. Key sectors include View diagram North America GDP
IDA and IBRD total GDP
IDA and IBRD total GDP from 1990 to today. World Bank and OECD data. GDP in US dollars. The total GDP of IDA and IBRD countries represents a broad range of developing and middle-income economies. This collective economic output reflects View diagram IDA and IBRD total GDP
Latin America and Caribbean GDP
Latin America and Caribbean GDP from 1990 to today. World Bank and OECD data. GDP in US dollars. This region features middle-income economies with strong agriculture, mining, and service sectors. GDP growth is often challenged by inequality, infrastructure needs, and View diagram Latin America and Caribbean GDP
East Asia and Pacific (IDA and IBRD countries) Economy
East Asia and Pacific (IDA and IBRD countries) economy growth from 2000 to today. GDP (current US$). World Bank and OECD national accounts data. These economies range from low to middle income and are rapidly industrializing. Growth is led by View diagram East Asia and Pacific (IDA and IBRD countries) Economy
Thailand Economy
Thailand relies on a mix of manufacturing, tourism, agriculture, and logistics. Electronics, automotive components, and food processing remain core export sectors. Tourism continues to be a major economic engine, drawing visitors from around the world. Agricultureespecially rice, rubber, and fruitsupports View diagram Thailand Economy
Library Management Er System
The Entity-Relationship (ER) diagram is a graphical representation of entities and their relationships in a database. It is widely used in software development to analyze the structure of a database. For a library management system, the ER diagram helps to View diagram Library Management Er System
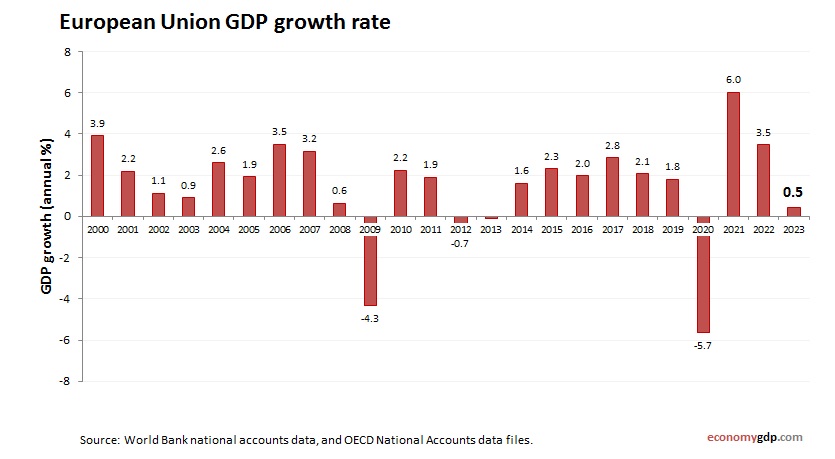
European Union GDP growth rate
European Union economy annual growth rate from 2000 to today. GDP growth (yearly %). World Bank and OECD national accounts data. The EU economy grew by 0.45% in 2023, reflecting economic stagnation due to weak demand, inflation, and rising interest View diagram European Union GDP growth rate
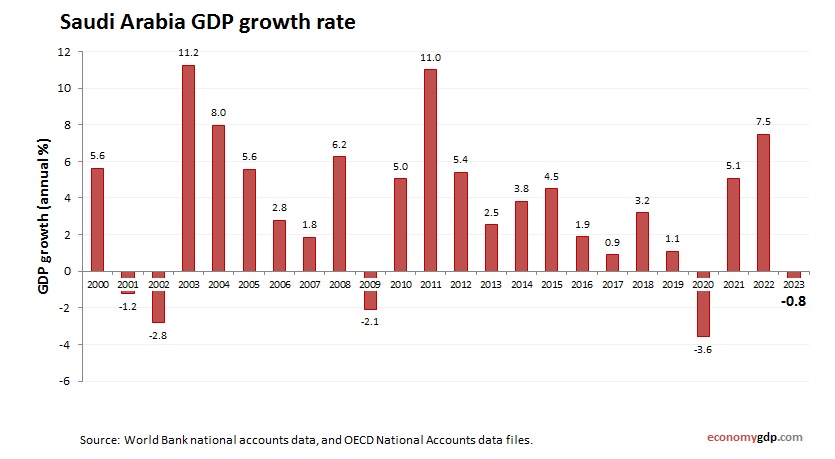
Saudi Arabia GDP growth rate
Saudi Arabia economy annual growth rate from 2000 to today. GDP growth (yearly %). World Bank and OECD national accounts data. Saudi Arabias economy grew at a slower pace of 0.8% in 2023, reflecting oil production cuts and lower prices. View diagram Saudi Arabia GDP growth rate