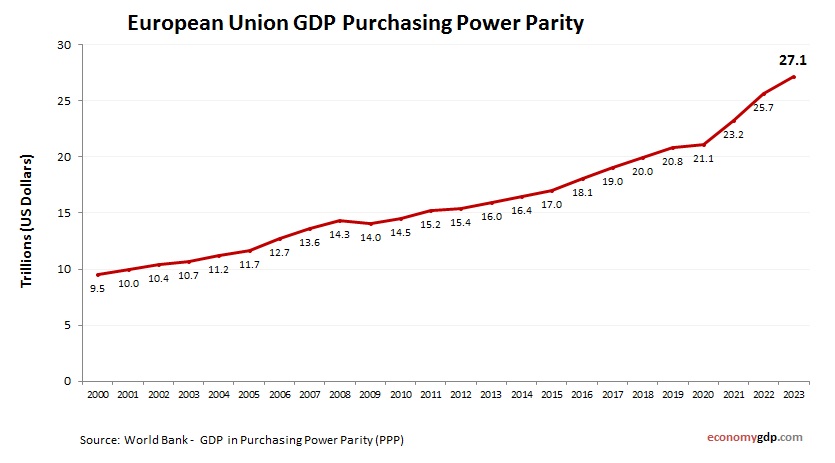
European Union Economy in Graphs
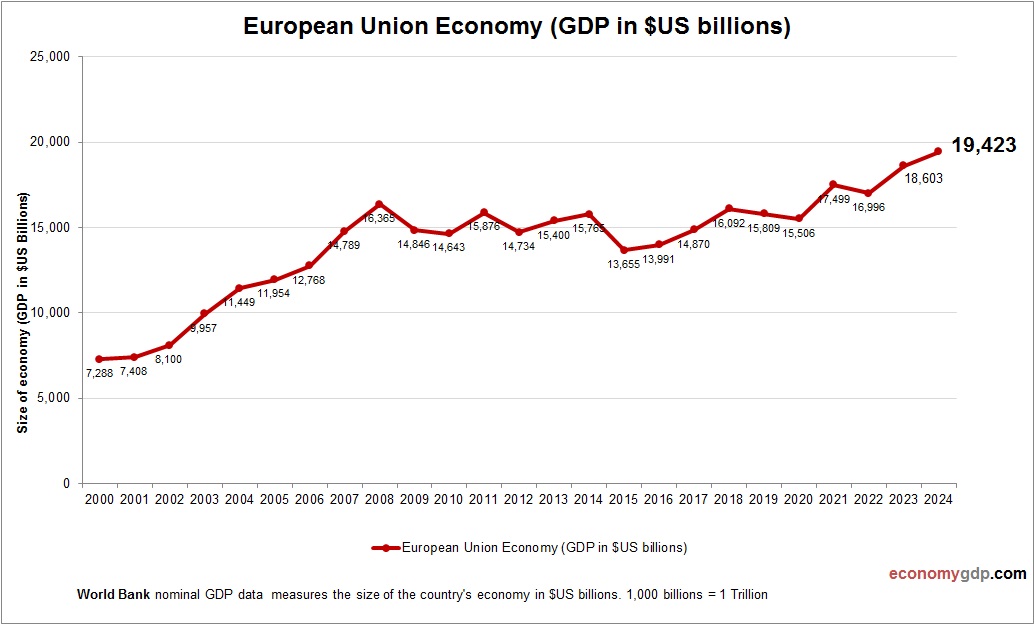
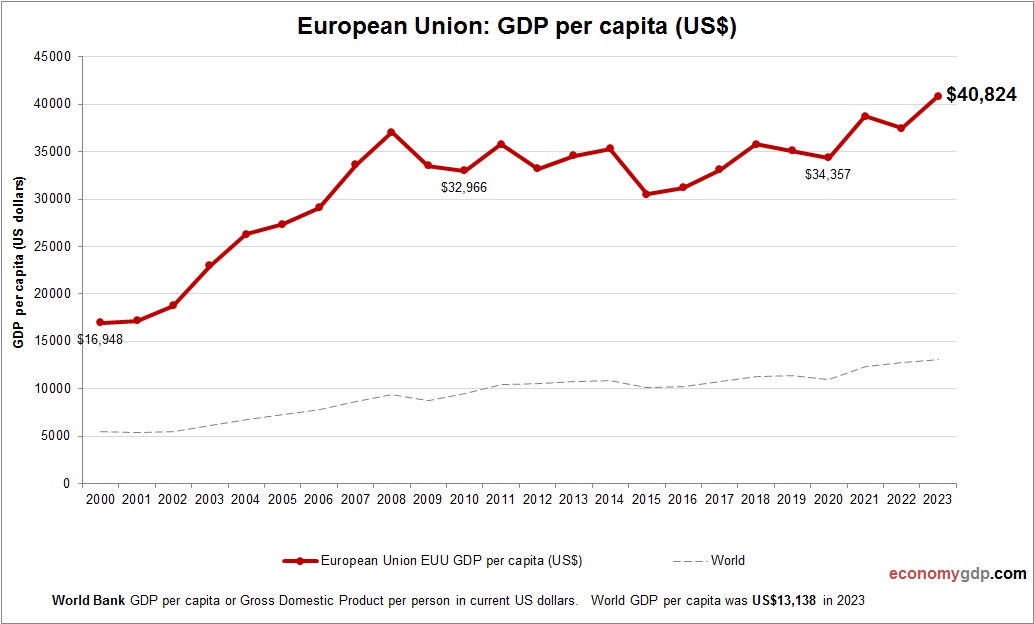
The European Union economy is a global powerhouse, driven by diverse industries, services, and trade. Manufacturing, particularly in Germany and France, includes automobiles and machinery, while services dominate in finance and technology. Agriculture and renewable energy are also key. Integration View diagram European Union Economy in Graphs