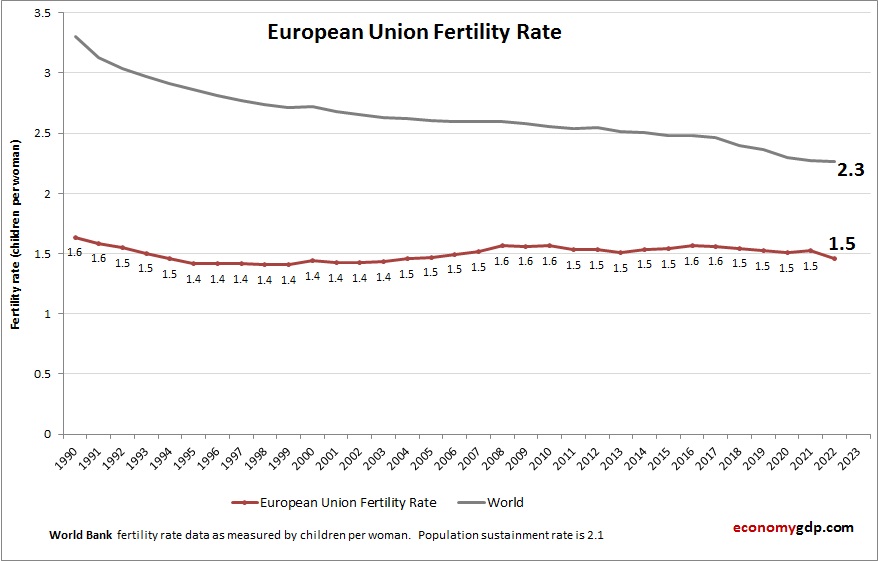
European Union Children Per woman
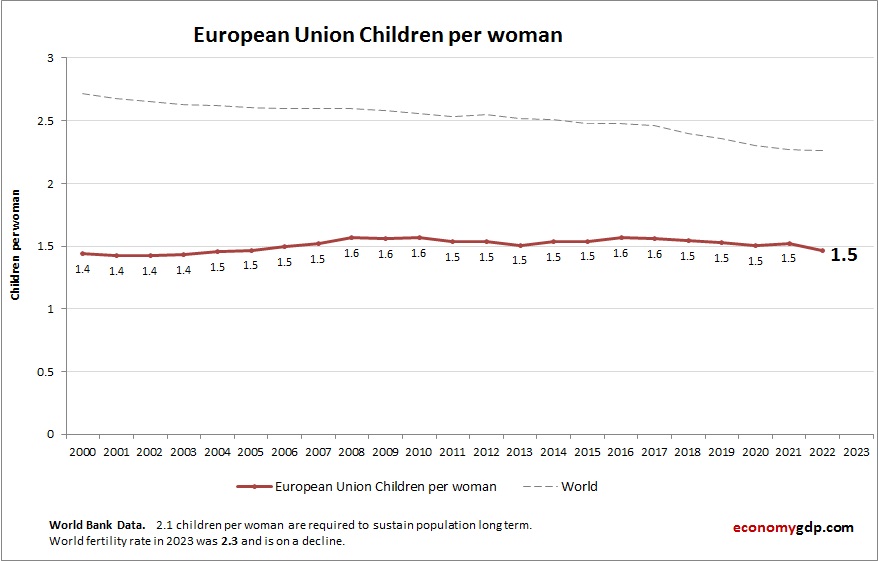
Chart above demonstrates European Union Children Per woman. The fertility rate statistics are compiled by World Bank. Based on the latest demographics info provided for European Union. The children per woman rate in the European Union is low. Aging populations, View diagram European Union Children Per woman