Skip to content
cropped-economygdp.jpg

Economy GDP

World economy charts, business frameworks and diagrams

Menu

Primary menu

  • Economy
    • Top Economies
  • Demographics
  • Business
    • Strategy
    • Project Management
    • Industry Examples
    • Leadership
    • HR
    • Industry Examples
  • Framework
  • Analysis
  • Lean Six Sigma
    • Lean
  • IT
    • Social Media
  • Marketing
  • Stories
  • Top

South Asia IDA and IBRD GDP growth rate

South Asia IDA and IBRD GDP growth rate

South Asia IDA and IBRD economy annual growth rate from 2000 to today. GDP growth (yearly %). World Bank and OECD national accounts data. These countries showed solid performance in 2023, largely driven by growth in India, Bangladesh, and other View diagram South Asia IDA and IBRD GDP growth rate→

Posted in Economy

Tech Startup Business Plan

Tech Startup Business Plan

A business plan is a crucial document for any startup, and it’s no different for a tech startup. It provides a roadmap for the company’s future, outlines its goals and objectives, and helps secure funding from investors. Here are some View diagram Tech Startup Business Plan→

Posted in Framework

Management Analysis Cycle

Management Analysis Cycle

The performance management cycle is a model that allows management and employees to better achieve organizational goals through a structured process of employee development. The performance management cycle is a part of the performance management process or strategy, it is View diagram Management Analysis Cycle→

Posted in Framework

Kiribati GDP growth rate

Kiribati GDP growth rate

Kiribati economy growth rate from 2000 to today. GDP growth (annual %). World Bank and OECD national accounts data. Kiribati’s economy is small and dependent on external aid, fishing licenses, and remittances. Efforts are focused on addressing climate vulnerability and View diagram Kiribati GDP growth rate→

Posted in Economy

United States GDP Purchasing Power Parity

United States GDP Purchasing Power Parity

United States economy graph showing purchasing power parity (PPP) growth from 2000 to today. Purchasing power parity adjusts the size of the economy to relevant price levels, i.e. measuring the price of specific goods in different countries and adjusting GDP View diagram United States GDP Purchasing Power Parity→

Posted in Economy | Tagged United States, United States economy, United States gdp, United States statistics

Euro area GDP PPP

Euro area GDP PPP

Euro area economy graph showing purchasing power parity (PPP) growth from 2000 to today. Purchasing power parity adjusts the size of the economy to relevant price levels, i.e. measuring the price of specific goods in different countries and adjusting GDP View diagram Euro area GDP PPP→

Posted in Economy | Tagged Euro area economy, Euro area gdp

Middle East and North Africa (excluding high income) Economy

Middle East and North Africa (excluding high income) Economy

Middle East and North Africa (excluding high income) economy growth from 2000 to today. GDP (current US$). World Bank and OECD national accounts data. This region’s economy includes mainly middle-income countries with GDPs tied to oil, agriculture, and tourism. Reforms View diagram Middle East and North Africa (excluding high income) Economy→

Posted in Economy

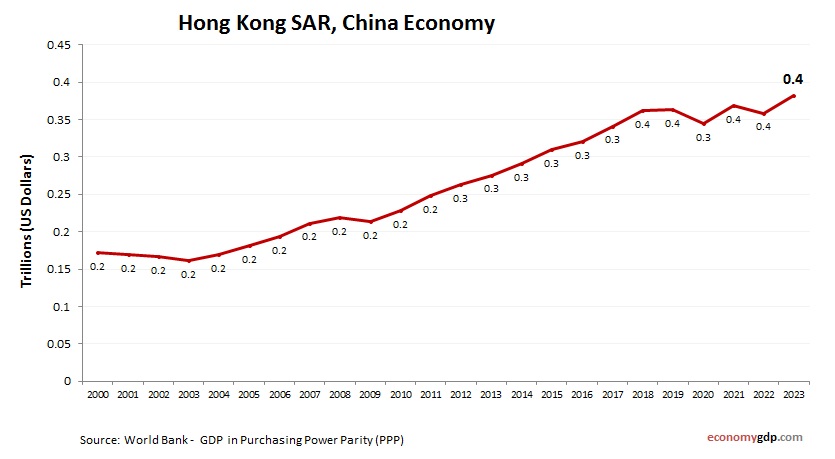
Hong Kong SAR, China Economy

Hong Kong SAR, China Economy

Hong Kong SAR, China economy growth from 2000 to today. GDP (current US$). World Bank and OECD national accounts data. Hong Kong has a high-income economy built on finance, trade, and professional services. Its open-market policies and strategic global role View diagram Hong Kong SAR, China Economy→

Posted in Economy | Tagged hong kong, hong kong economy, hong kong gdp

Europe and Central Asia (IDA and IBRD countries) GDP growth rate

Europe and Central Asia (IDA and IBRD countries) GDP growth rate

Europe and Central Asia (IDA and IBRD countries) economy annual growth rate from 2000 to today. GDP growth (yearly %). World Bank and OECD national accounts data. Countries in this group had diverse outcomes in 2023. While some nations showed View diagram Europe and Central Asia (IDA and IBRD countries) GDP growth rate→

Posted in Economy

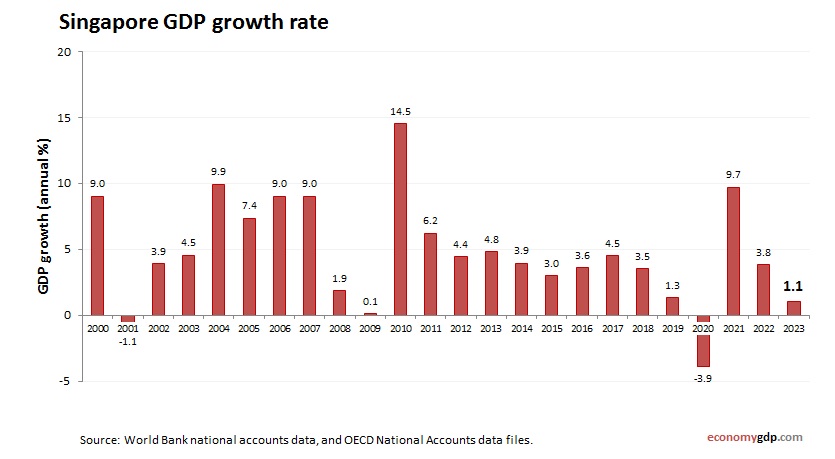
Singapore GDP growth rate

Singapore GDP growth rate

Singapore economy annual growth rate from 2000 to today. GDP growth (yearly %). World Bank and OECD national accounts data. Singapore posted a GDP growth rate of 1.2% in 2023. The economy was supported by the finance and technology sectors, View diagram Singapore GDP growth rate→

Posted in Economy | Tagged Singapore economy, Singapore gdp

Post navigation

← Older posts
Newer posts →

Primary Sidebar Widget Area

Top Diagrams

Latest Posts

  • Poland’s Economy – The Newest Member of the $1 Trillion Club
  • Ways to Make Money Fast Illustration
  • Business Model Framework Sample
  • North America Children Per woman
  • Turkey’s Economy – A $1.6 Trillion Economy That Can’t Shake Inflation
  • Mozambique Economy
  • Bulgaria Inflation
  • Saudi Arabia’s Economy – The Oil Giant Trying to Outgrow Oil
  • Suriname Children Per woman
  • Architecture Diagram for Salesforce Trailhead
  • Switzerland’s Economy – Small Country, Enormous Paycheck
  • Zambia GDP
  • Liechtenstein GDP PPP
  • Turkmenistan Economy
  • Netherlands Economy – European Logistics Hub
  • Twitter
Copyright © 2026 Economy GDP. All Rights Reserved.
Theme: Catch Box by Catch Themes
Scroll Up