Skip to content
cropped-economygdp.jpg

Economy GDP

World economy charts, business frameworks and diagrams

Menu

Primary menu

  • Economy
    • Top Economies
  • Demographics
  • Business
    • Strategy
    • Project Management
    • Industry Examples
    • Leadership
    • HR
    • Industry Examples
  • Framework
  • Analysis
  • Lean Six Sigma
    • Lean
  • IT
    • Social Media
  • Marketing
  • Stories
  • Top

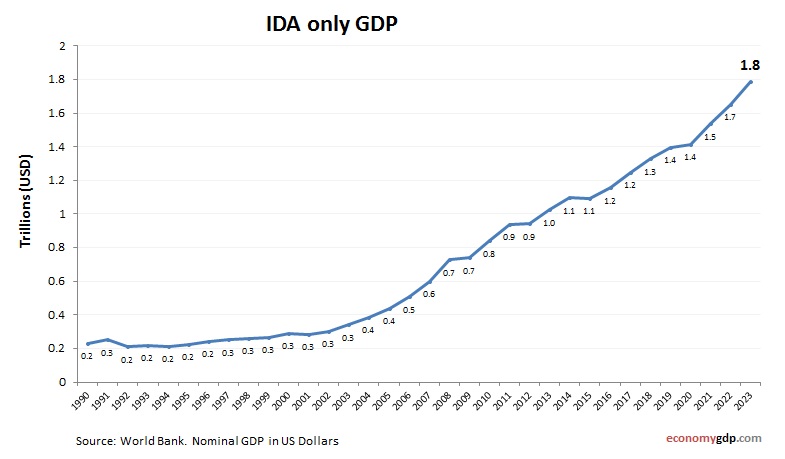
IDA only GDP

IDA only GDP

IDA only GDP from 1990 to today. World Bank and OECD data. GDP in US dollars. IDA-only countries have very low GDP levels, often reliant on subsistence agriculture and aid. These economies face significant development challenges including poor infrastructure, conflict, View diagram IDA only GDP→

Posted in Economy | Tagged IDA only economy, IDA only gdp

IDA and IBRD total Economy

IDA and IBRD total Economy

IDA and IBRD total economy growth from 2000 to today. GDP (current US$). World Bank and OECD national accounts data. The combined economies under IDA and IBRD support represent a wide spectrum of developing countries. Their GDP varies from low View diagram IDA and IBRD total Economy→

Posted in Economy

China GDP growth rate

China GDP growth rate

China economy annual growth rate from 2000 to today. GDP growth (yearly %). World Bank and OECD national accounts data. China’s economy grew by 5.2% in 2023. This was driven by strong industrial production, infrastructure investment, and a recovery in View diagram China GDP growth rate→

Posted in Economy | Tagged China economy, China gdp

OECD members GDP growth rate

OECD members GDP growth rate

OECD members economy annual growth rate from 2000 to today. GDP growth (yearly %). World Bank and OECD national accounts data. OECD member countries posted a collective GDP growth rate of 1.5% in 2023. Most advanced economies within the group View diagram OECD members GDP growth rate→

Posted in Economy | Tagged OECD members economy, OECD members gdp

Low and middle income Economy

Low and middle income Economy

Low and middle income economy growth from 2000 to today. GDP (current US$). World Bank and OECD national accounts data. These economies vary in size and structure but share the goal of poverty reduction and economic growth. GDP is shaped View diagram Low and middle income Economy→

Posted in Economy

Create A Business Plan

Create A Business Plan

A business plan is a formal written document that outlines the goals of a business, the methods for achieving those goals, and the time frame for achieving them . It is an essential tool for entrepreneurs who are starting a View diagram Create A Business Plan→

Posted in Framework

Europe and Central Asia (excluding high income) GDP

Europe and Central Asia (excluding high income) GDP

Europe and Central Asia (excluding high income) GDP from 1990 to today. World Bank and OECD data. GDP in US dollars. This GDP group includes transition economies with industrial and energy-based outputs. Growth is aided by trade and reforms, though View diagram Europe and Central Asia (excluding high income) GDP→

Posted in Economy

United Arab Emirates GDP

United Arab Emirates GDP

United Arab Emirates GDP from 2010 to today. World Bank and OECD data. GDP in US dollars. The UAE's GDP is a blend of traditional oil wealth and rapid diversification into tourism, real estate, trade, and finance. Dubai and Abu View diagram United Arab Emirates GDP→

Posted in Economy | Tagged United Arab Emirates economy, United Arab Emirates gdp

United Kingdom GDP

United Kingdom GDP

United Kingdom GDP from 2010 to today. World Bank and OECD data. GDP in US dollars. The United Kingdom has one of the world's largest economies, with GDP driven primarily by services, especially finance, business services, healthcare, and education. London View diagram United Kingdom GDP→

Posted in Economy | Tagged United Kingdom economy, United Kingdom gdp

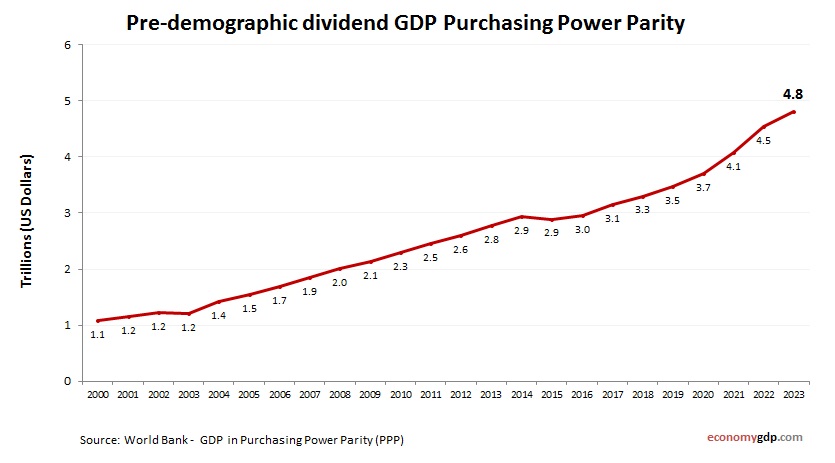
Pre-demographic dividend GDP Purchasing Power Parity

Pre-demographic dividend GDP Purchasing Power Parity

Pre-demographic dividend economy graph showing purchasing power parity (PPP) growth from 2000 to today. Purchasing power parity adjusts the size of the economy to relevant price levels, i.e. measuring the price of specific goods in different countries and adjusting GDP View diagram Pre-demographic dividend GDP Purchasing Power Parity→

Posted in Economy | Tagged Pre-demographic dividend economy, Pre-demographic dividend gdp

Post navigation

← Older posts
Newer posts →

Primary Sidebar Widget Area

Top Diagrams

Latest Posts

  • Poland’s Economy – The Newest Member of the $1 Trillion Club
  • Ways to Make Money Fast Illustration
  • Business Model Framework Sample
  • North America Children Per woman
  • Turkey’s Economy – A $1.6 Trillion Economy That Can’t Shake Inflation
  • Mozambique Economy
  • Bulgaria Inflation
  • Saudi Arabia’s Economy – The Oil Giant Trying to Outgrow Oil
  • Suriname Children Per woman
  • Architecture Diagram for Salesforce Trailhead
  • Switzerland’s Economy – Small Country, Enormous Paycheck
  • Zambia GDP
  • Liechtenstein GDP PPP
  • Turkmenistan Economy
  • Netherlands Economy – European Logistics Hub
  • Twitter
Copyright © 2026 Economy GDP. All Rights Reserved.
Theme: Catch Box by Catch Themes
Scroll Up