China GDP per capita
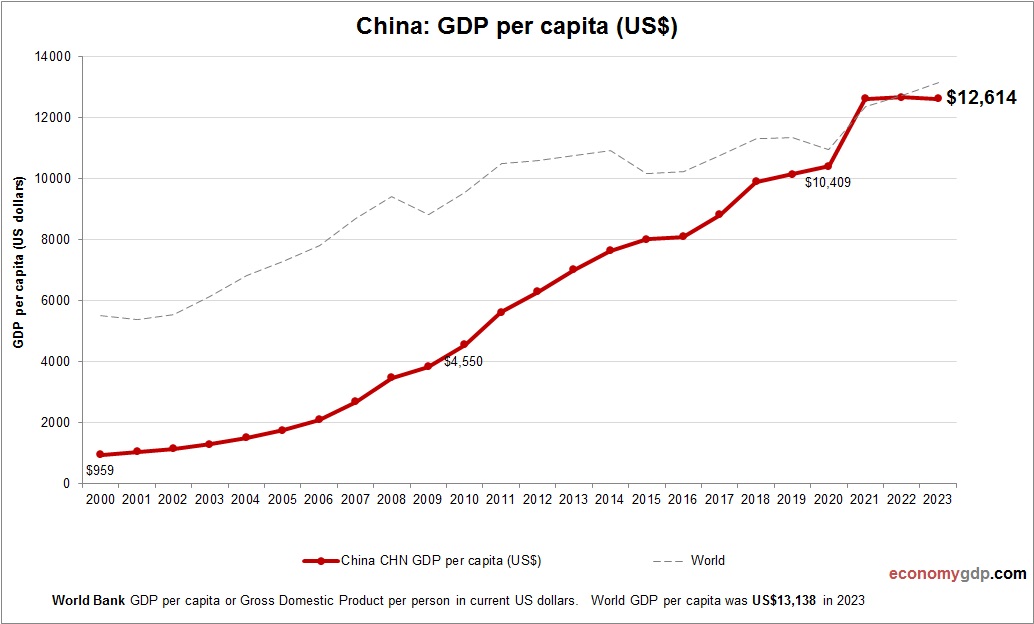
This diagram presents China GDP per capita. The economic data is provided by World Bank. Based on the latest economic info provided for China. China’s GDP per capita has grown rapidly in recent decades, lifting hundreds of millions out of View diagram China GDP per capita