Bhutan Inflation
This graph shows Bhutan Inflation. Inflation data is sourced from World Bank. Based on the latest available information for Bhutan. Bhutan experiences inflation primarily due to its close economic ties with India. Price movements in India, particularly for food and View diagram Bhutan Inflation
Channel Islands Fertility Rate
Chart above demonstrates Channel Islands Fertility Rate. World Bank is the source of this birth data. Latest births per woman information for Channel Islands. The Channel Islands have a low fertility rate, consistent with other affluent European regions. Economic conditions View diagram Channel Islands Fertility Rate
Sint Maarten (Dutch part) Children Per woman
The above graph shows Sint Maarten (Dutch part) Children Per woman. World Bank is the source of this birth data. Latest births per woman information for Sint Maarten (Dutch part). Sint Maarten has a relatively low children per woman rate, View diagram Sint Maarten (Dutch part) Children Per woman
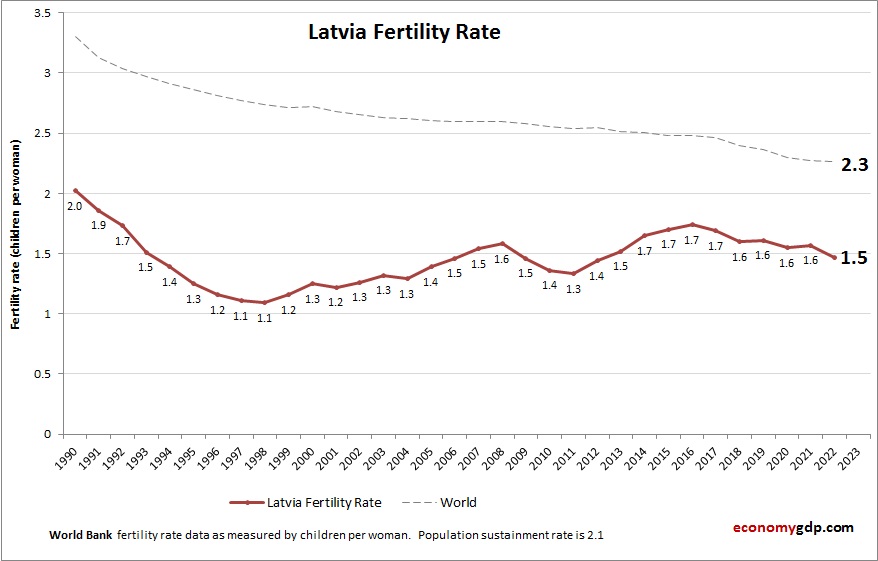
Latvia Fertility Rate
Chart above demonstrates Latvia Fertility Rate. World Bank is the source of this birth data. Based on the latest available information for Latvia. Latvia has a low fertility rate. Economic migration, aging population, and delayed family formation are contributing to View diagram Latvia Fertility Rate
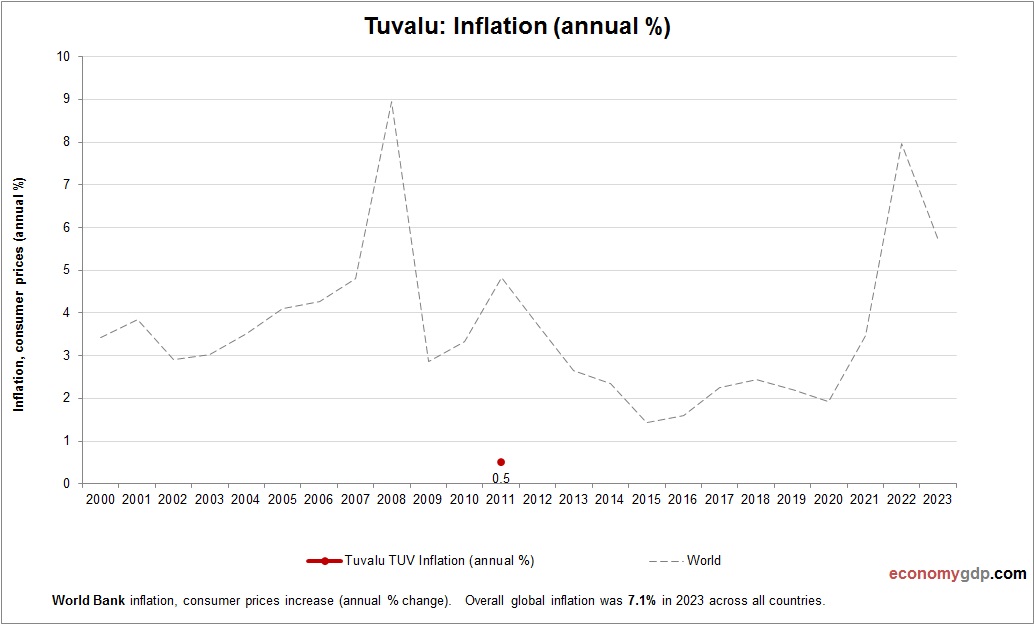
Tuvalu Inflation
This chart demonstrates Tuvalu Inflation. This is according to World Bank consumer price index stats by country. Based on the latest available information for Tuvalu. Tuvalus inflation results from high shipping costs, import dependency, and vulnerability to climate impacts on View diagram Tuvalu Inflation
Brunei Darussalam Children Per woman
Chart above demonstrates Brunei Darussalam Children Per woman. This is according to World Bank birth stats by country. Based on the latest available information for Brunei Darussalam. Women in Brunei have around two children on average, balancing traditional family values View diagram Brunei Darussalam Children Per woman
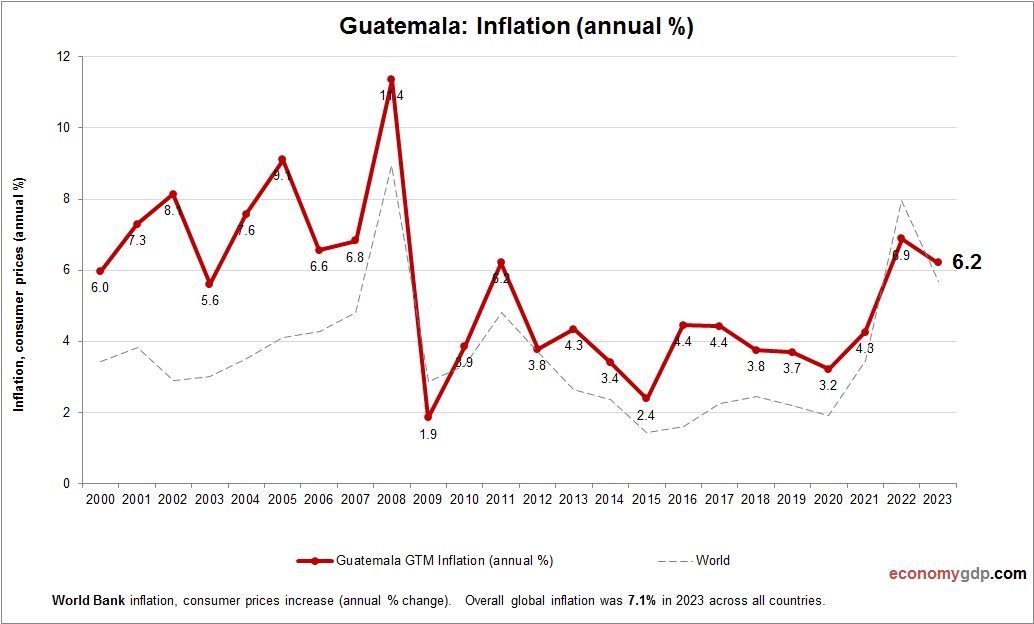
Guatemala Inflation
This chart demonstrates Guatemala Inflation. Inflation data is sourced from World Bank. Based on the latest economic data provided for Guatemala. Inflation in Guatemala is driven by food price increases, fuel costs, and supply chain inefficiencies, particularly in rural and View diagram Guatemala Inflation
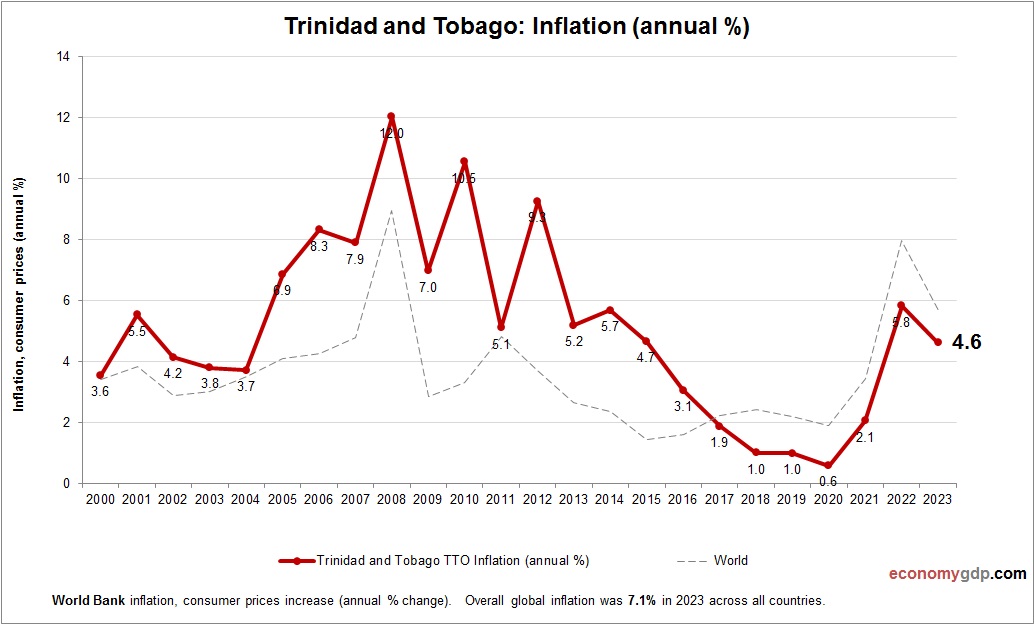
Trinidad and Tobago Inflation
This graph shows Trinidad and Tobago Inflation. This is according to World Bank consumer price index stats by country. Change in consumer prices for Trinidad and Tobago. Inflation here is relatively moderate but influenced by global energy prices, as the View diagram Trinidad and Tobago Inflation
Guinea Fertility Rate
This diagram presents Guinea Fertility Rate. World Bank is the source of this birth data. Latest births per woman information for Guinea. Guinea maintains a high fertility rate, with women having around five children. Socioeconomic factors, early marriage, and limited View diagram Guinea Fertility Rate