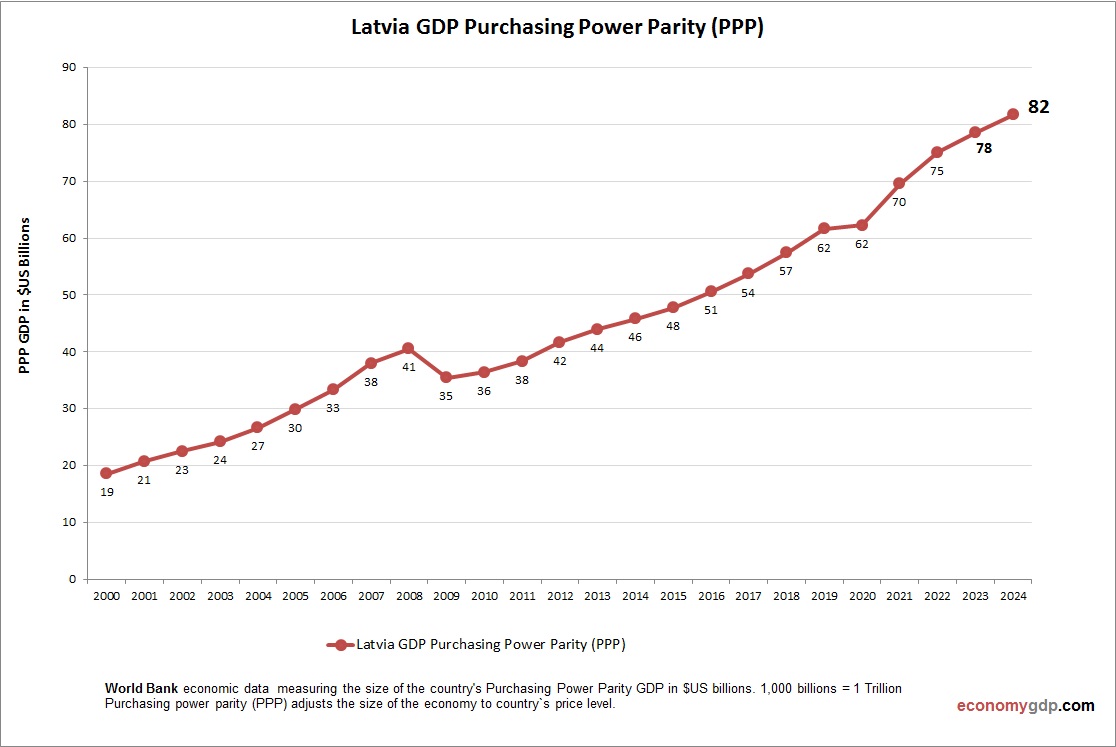
Skip to content
cropped-economygdp.jpg

Economy GDP

World economy charts, business frameworks and diagrams

Menu

Primary menu

  • Economy
    • Top Economies
  • Demographics
  • Business
    • Strategy
    • Project Management
    • Industry Examples
    • Leadership
    • HR
    • Industry Examples
  • Framework
  • Analysis
  • Lean Six Sigma
    • Lean
  • IT
    • Social Media
  • Marketing
  • Stories
  • Top

Tag Archives: Latvia statistics

Latvia GDP PPP

Latvia GDP PPP

Latvia’s PPP GDP was $77.5 billion in 2023. Services, manufacturing, and forestry are key, with GDP per capita (PPP) at $41,200. EU membership drives trade, but an aging population and regional tensions pose risks. Tech and green energy sectors are View diagram Latvia GDP PPP→

Posted in Economy | Tagged Latvia, Latvia statistics

Latvia Fertility Rate

Latvia Fertility Rate

Chart above demonstrates Latvia Fertility Rate. World Bank is the source of this birth data. Based on the latest available information for Latvia. Latvia has a low fertility rate. Economic migration, aging population, and delayed family formation are contributing to View diagram Latvia Fertility Rate→

Posted in Demographics | Tagged Latvia demographics, Latvia statistics

Primary Sidebar Widget Area

Top Diagrams

Latest Posts

  • Syria Economy in Graphs
  • Algeria GDP Purchasing Power Parity
  • Customer Journey Map/Sales Customer Journey Map
  • Quantitative Data Analysis Methods
  • Marshall Plan Postwar Economic Recovery
  • Equatorial Guinea GDP PPP
  • Latvia GDP PPP
  • Business Model Framework PPT Slide
  • End of Bretton Woods 1971: Rise of Fiat Currency
  • Bermuda GDP PPP
  • Micronesia Inflation
  • Germany Children Per woman
  • Haiti GDP PPP
  • Africa Eastern and Southern ChildrenPer woman
  • Mississippi Bubble 1720: France’s First Financial Crash
  • Twitter
Copyright © 2026 Economy GDP. All Rights Reserved.
Theme: Catch Box by Catch Themes
Scroll Up