
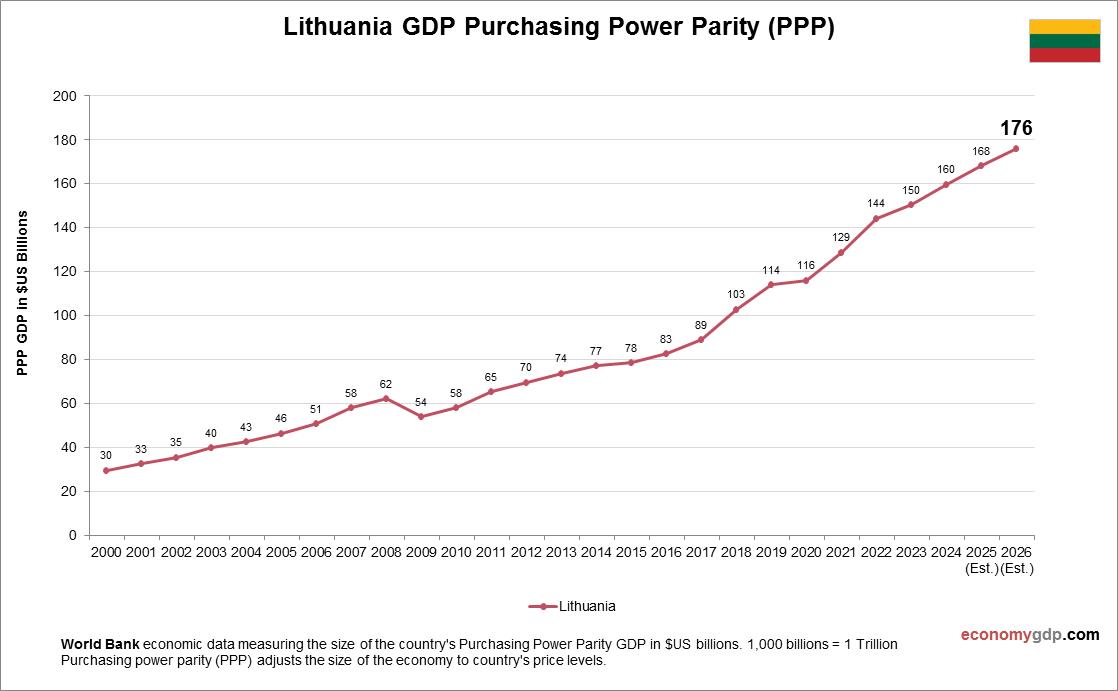
Lithuanias PPP GDP was $135.7 billion in 2023. Services, manufacturing, and tech drive growth, with GDP per capita (PPP) at $48,400. EU integration supports trade, but an aging population and regional tensions challenge sustainability. Innovation in tech is a strength.[](https://ec.europa.eu/eurostat/statistics-explained/index.php?title=Purchasing_power_parities_and_GDP_per_capita_-_preliminary_estimate)
Lithuania GDP PPP Statistics by Year
| Year | GDP, Purchasing Power Parity (PPP) |
| 2000 | 29.7 |
| 2001 | 32.6 |
| 2002 | 35.4 |
| 2003 | 39.8 |
| 2004 | 42.6 |
| 2005 | 46.4 |
| 2006 | 50.8 |
| 2007 | 58.1 |
| 2008 | 62.1 |
| 2009 | 53.9 |
| 2010 | 58.0 |
| 2011 | 65.3 |
| 2012 | 69.6 |
| 2013 | 73.7 |
| 2014 | 77.2 |
| 2015 | 78.5 |
| 2016 | 82.6 |
| 2017 | 89.0 |
| 2018 | 102.9 |
| 2019 | 114.0 |
| 2020 | 116.0 |
| 2021 | 128.8 |
| 2022 | 144.2 |
| 2023 | 150.3 |
| 2024 | 159.7 |
| 2025 (Est.) | 168.0 |
| 2026 (Est.) | 176.0 |