
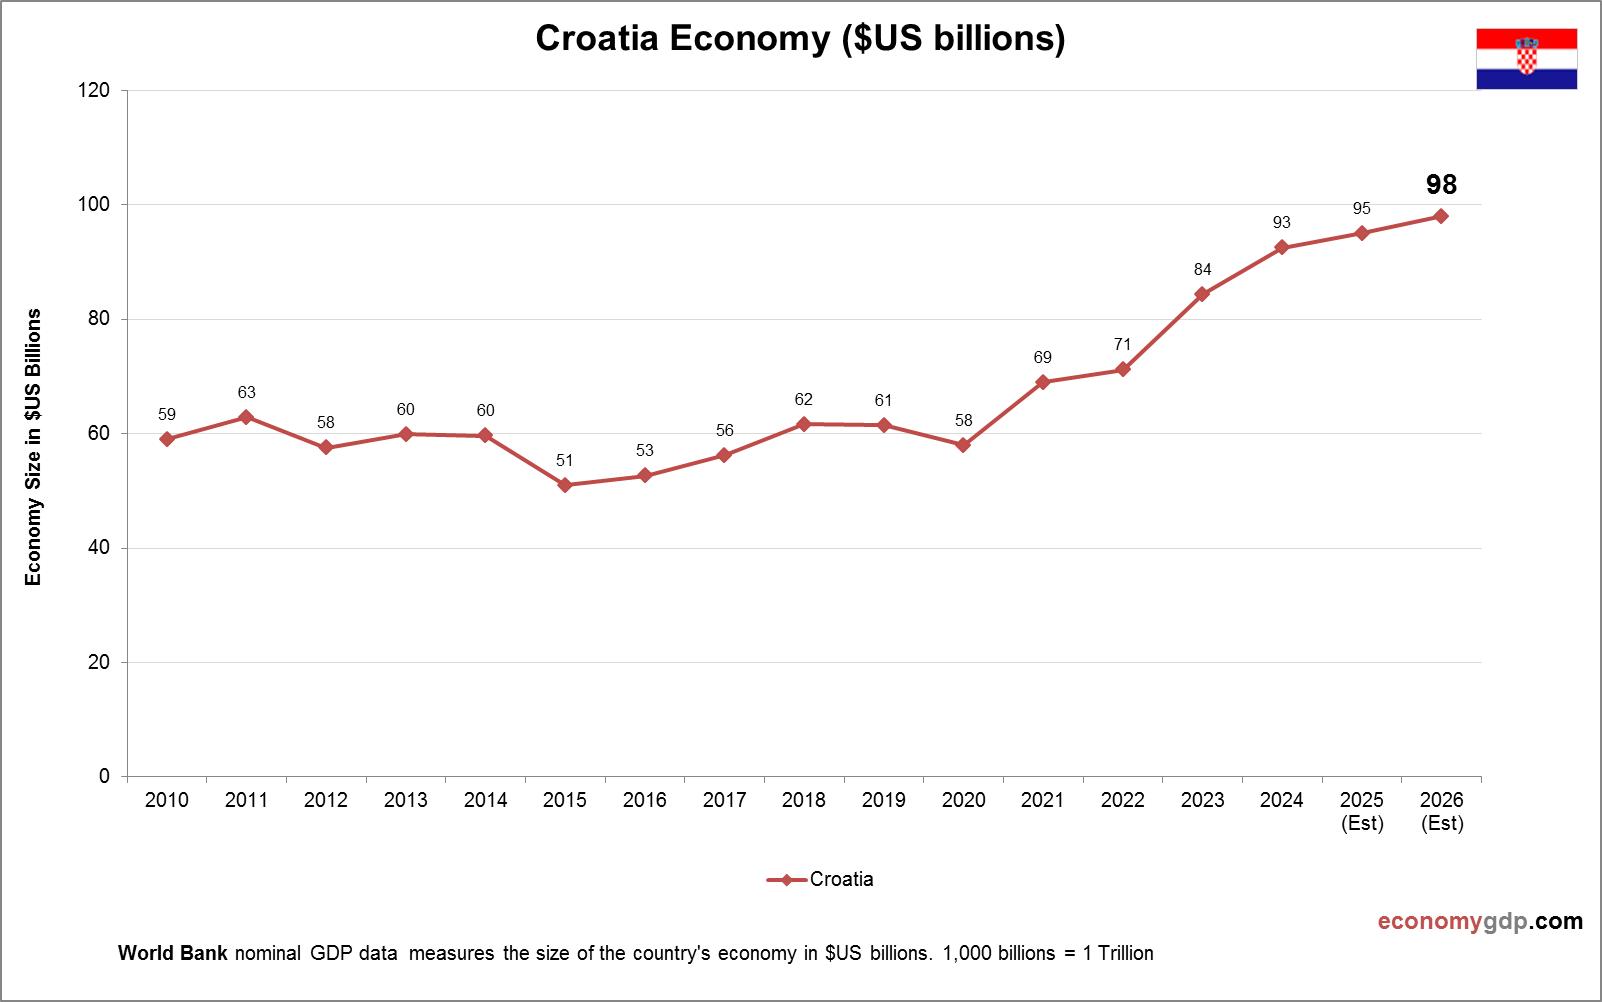
The Croatia economy is driven by tourism, manufacturing, and services within the EU. Adriatic coast tourism, including Dubrovnik, generates significant revenue, while shipbuilding and food processing support exports. EU membership has spurred infrastructure investment, but high public debt and unemployment persist. Efforts to boost innovation and renewable energy aim to enhance growth, though bureaucratic inefficiencies and an aging population challenge long-term sustainability in a competitive regional market.
Croatia Economy Size
Croatia’s economy, worth $70 billion, is moderately sized within the EU. Tourism and industry shape its GDP, with growth tied to European market access. See Croatia GDP.

Croatia Purchasing Power Parity (PPP)
Croatia’s economy has a PPP GDP of $160 billion, over double its $70 billion nominal GDP, due to lower costs for tourism and industry. PPP per capita is around $40,000, reflecting high living standards within the EU. PPP highlights domestic market strength, but an aging population limits broader economic expansion.

Croatia Growth Rate
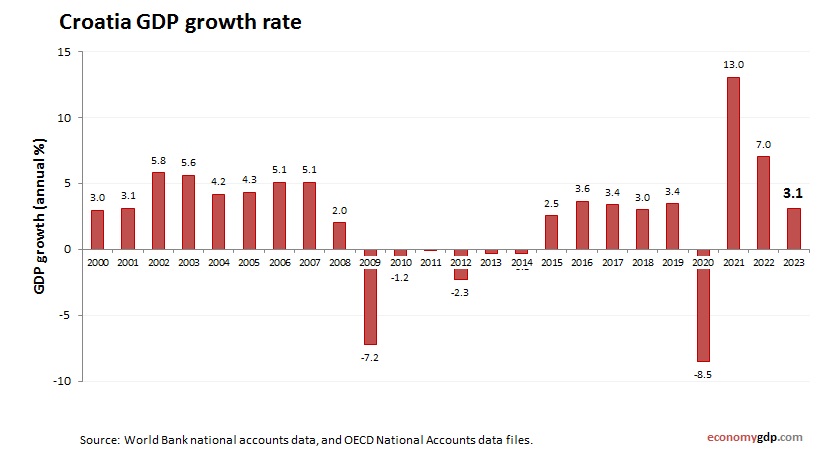
The economic growth rate is 2.8% in 2024, fueled by tourism and manufacturing. EU integration and recovery from global disruptions drive growth, but an aging population and high debt limit gains. Agriculture and shipping contribute, while renewable energy investments support resilience, positioning the economy for moderate expansion within the EU.
Croatia Inflation
Croatia’s inflation rate is around 3% in 2024, driven by rising energy and food import costs within the EU. Tourism recovery increases service prices, while wage growth adds demand-side pressure. Euro adoption and monetary tightening help stabilize inflation, though reliance on imports and global price trends pose ongoing risks.
