
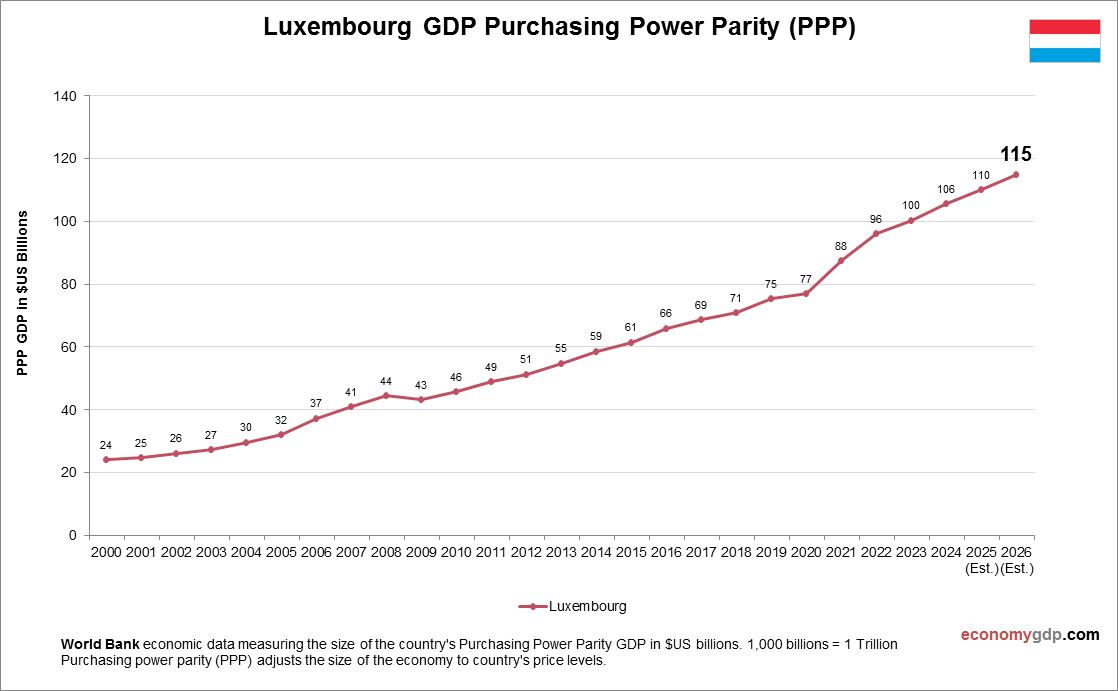
Luxembourgs PPP GDP was $94.1 billion in 2023. Finance, steel, and services dominate, with GDP per capita (PPP) at $140,300, the highest globally. EU integration and tax policies drive growth, though global regulatory scrutiny poses risks. Tech and green finance are emerging.[](https://ec.europa.eu/eurostat/statistics-explained/index.php?title=Purchasing_power_parities_and_GDP_per_capita_-_preliminary_estimate)
Luxembourg GDP PPP Statistics by Year
| Year | GDP, Purchasing Power Parity (PPP) |
| 2000 | 24.1 |
| 2001 | 24.8 |
| 2002 | 26.1 |
| 2003 | 27.2 |
| 2004 | 29.6 |
| 2005 | 32.0 |
| 2006 | 37.3 |
| 2007 | 40.9 |
| 2008 | 44.5 |
| 2009 | 43.3 |
| 2010 | 45.8 |
| 2011 | 49.0 |
| 2012 | 51.3 |
| 2013 | 54.8 |
| 2014 | 58.6 |
| 2015 | 61.4 |
| 2016 | 66.0 |
| 2017 | 68.6 |
| 2018 | 70.9 |
| 2019 | 75.3 |
| 2020 | 77.0 |
| 2021 | 87.5 |
| 2022 | 96.0 |
| 2023 | 100.3 |
| 2024 | 105.6 |
| 2025 (Est.) | 110.0 |
| 2026 (Est.) | 115.0 |