
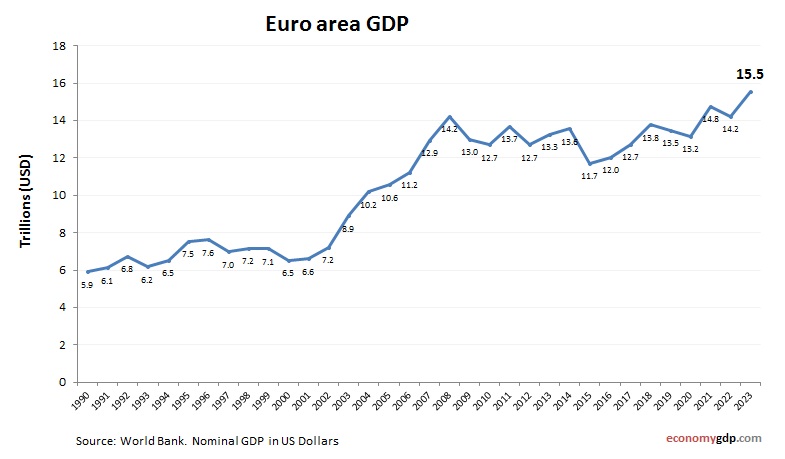
Euro area GDP from 2010 to today. World Bank and OECD data. GDP in US dollars. The Euro area's GDP encompasses the economies of countries using the euro currency, making it one of the largest global economic entities. Industry, services, and agriculture vary across members, with Germany, France, and Italy serving as key economic drivers. The single currency fosters trade, investment, and financial integration, while the European Central Bank oversees monetary policy. Challenges include differences in fiscal policy, varying growth rates among members, and external shocks. However, the Euro area remains a vital hub of global finance, trade, and innovation, with strong focus on sustainability, digitalization, and long-term economic stability. See Euro area GDP per capita.
Euro area GDP Statistics by Year
| Year | GDP Size (in billions $) |
| 2025 (projected) | 17,000 |
| 2024 | 16,406 |
| 2023 | 15,787 |
| 2022 | 14,452 |
| 2021 | 14,919 |
| 2020 | 13,267 |
| 2019 | 13,587 |
| 2018 | 13,868 |
| 2017 | 12,840 |
| 2016 | 12,125 |
| 2015 | 11,829 |
| 2014 | 13,683 |
| 2013 | 13,359 |
| 2012 | 12,787 |
| 2011 | 13,810 |
| 2010 | 12,786 |