
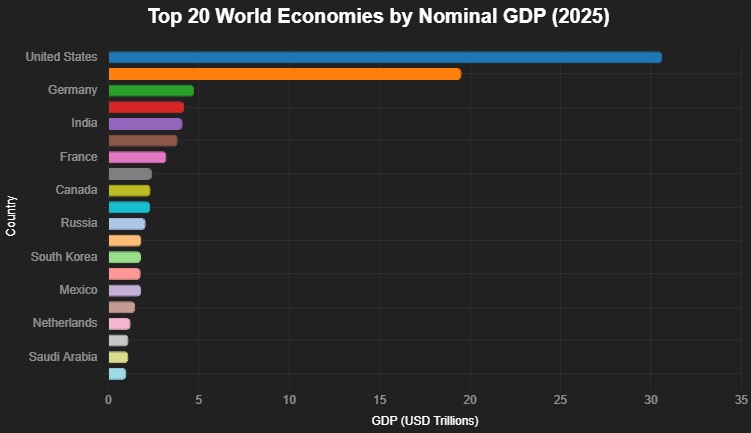
Here is an exciting list of the top world economies in 2025 with each country listed by rating showing the size of the economy (nominal Gross Domestic Product), purchasing power parity GDP (GDP PPP) and projected 2025 real growth rate:
| Rank | Country | Nominal GDP (2025, US$ trillion) | GDP (PPP, 2025, US$ trillion) | 2025 Real GDP growth |
|---|---|---|---|---|
| 1 | United States | 30.62 | 30.62 | 2.0% |
| 2 | China | 19.40 | 41.02 | 4.8% |
| 3 | Germany | 5.01 | 6.15 | 0.2% |
| 4 | Japan | 4.28 | 6.76 | 1.1% |
| 5 | India | 4.13 | 17.71 | 6.6% |
| 6 | United Kingdom | 3.96 | 4.45 | 1.3% |
| 7 | France | 3.36 | 4.53 | 0.7% |
| 8 | Italy | 2.54 | 3.72 | 0.5% |
| 9 | Russia | 2.54 | 7.14 | 0.6% |
| 10 | Canada | 2.28 | 2.72 | 1.2% |
| 11 | Brazil | 2.26 | 4.97 | 2.4% |
| 12 | Spain | 1.89 | 2.83 | 2.9% |
| 13 | Mexico | 1.86 | 3.44 | 1.0% |
| 14 | South Korea | 1.86 | 3.36 | 0.9% |
| 15 | Australia | 1.83 | 1.98 | 1.8% |
| 16 | Turkey | 1.57 | 3.77 | 3.5% |
| 17 | Indonesia | 1.44 | 5.02 | 4.9% |
| 18 | Netherlands | 1.32 | 1.32 | 1.4% |
| 19 | Saudi Arabia | 1.27 | 2.69 | 4.0% |
| 20 | Poland | 1.04 | 2.02 | 3.2% |
Note: The 2025 economic data is based on the IMF’s October 2025 World Economic Outlook while 2025 real growth rate are projections based on EconomyGDP.com research.