
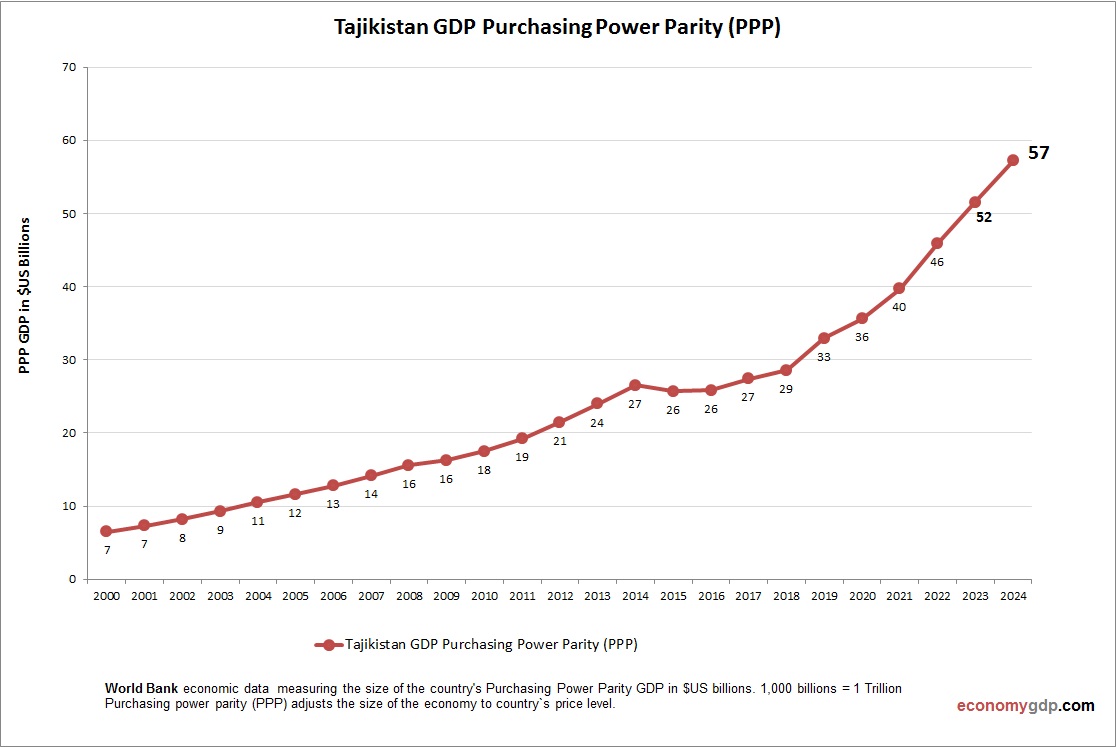
Tajikistans PPP GDP was $38.6 billion in 2023. Aluminum, cotton, and remittances dominate, with GDP per capita (PPP) at $4,100. Political stability supports growth, but poverty and weak infrastructure persist. Hydropower and regional trade offer potential. See all Tajikistan economy graphs.
Tajikistan GDP PPP Statistics by Year
| Year | GDP, Purchasing Power Parity (PPP) |
| 2000 | 6.5 |
| 2001 | 7.3 |
| 2002 | 8.2 |
| 2003 | 9.3 |
| 2004 | 10.5 |
| 2005 | 11.6 |
| 2006 | 12.8 |
| 2007 | 14.1 |
| 2008 | 15.6 |
| 2009 | 16.3 |
| 2010 | 17.5 |
| 2011 | 19.2 |
| 2012 | 21.5 |
| 2013 | 24.0 |
| 2014 | 26.6 |
| 2015 | 25.7 |
| 2016 | 25.8 |
| 2017 | 27.4 |
| 2018 | 28.6 |
| 2019 | 33.0 |
| 2020 | 35.6 |
| 2021 | 39.7 |
| 2022 | 46.0 |
| 2023 | 51.6 |
| 2024 | 57.3 |
| 2025 (Est.) | 62.0 |
| 2026 (Est.) | 67.0 |