
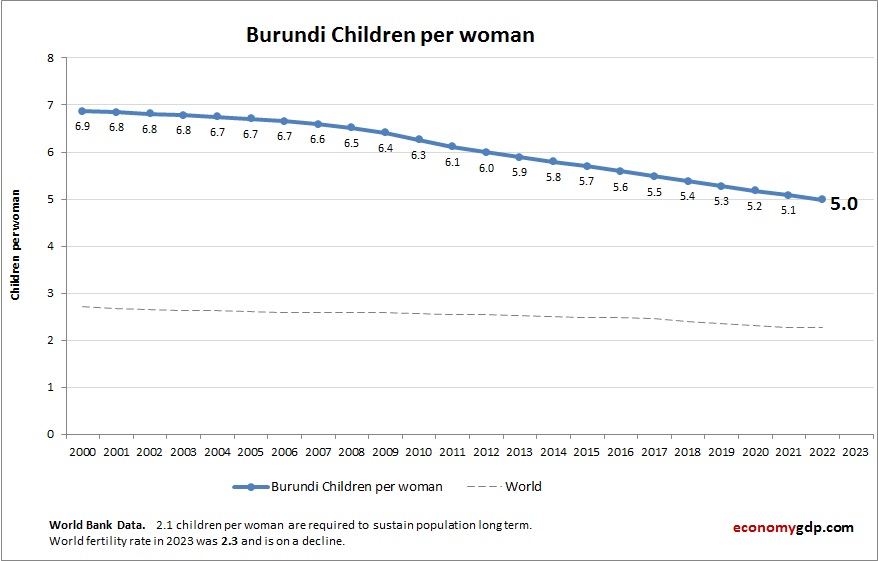
This diagram presents Burundi Children Per woman. This is according to World Bank birth stats by country. Latest births per woman information for Burundi.
Burundi has a high children per woman rate. Traditional values, limited access to healthcare, and high rural population sustain large families.
Burundi Children Per woman (Fertility Rate) Statistics by Year
| Year | Children per woman (fertility rate) |
| 2000 | 6.87 |
| 2001 | 6.85 |
| 2002 | 6.82 |
| 2003 | 6.79 |
| 2004 | 6.75 |
| 2005 | 6.71 |
| 2006 | 6.66 |
| 2007 | 6.59 |
| 2008 | 6.52 |
| 2009 | 6.41 |
| 2010 | 6.26 |
| 2011 | 6.11 |
| 2012 | 5.99 |
| 2013 | 5.89 |
| 2014 | 5.79 |
| 2015 | 5.70 |
| 2016 | 5.59 |
| 2017 | 5.48 |
| 2018 | 5.38 |
| 2019 | 5.27 |
| 2020 | 5.18 |
| 2021 | 5.08 |
| 2022 | 4.98 |
| 2023 | 4.88 |
| 2024 | 4.79 |
| 2025 (Est.) | 4.70 |
| 2026 (Est.) | 4.60 |