
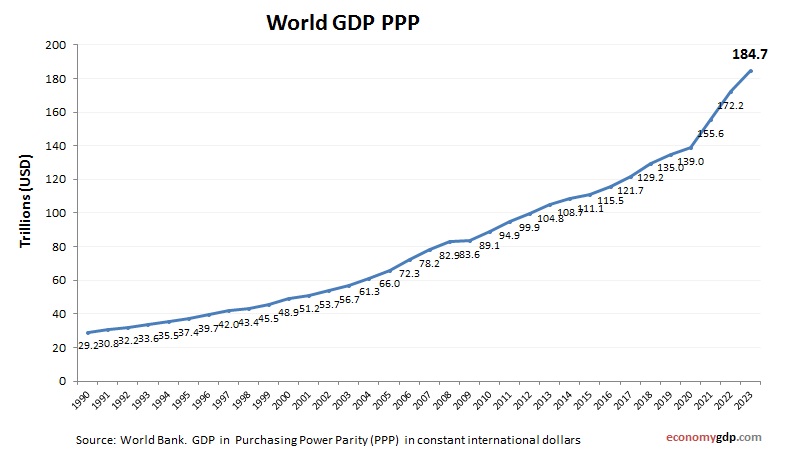
World economy graph showing purchasing power parity (PPP) growth from 1990 to today. Purchasing power parity adjusts the size of the economy to relevant price levels, i.e. measuring the price of specific goods in different countries and adjusting GDP accordingly.
The global GDP per capita (PPP) serves as a benchmark, representing the average economic output per person worldwide, adjusted for price levels across countries. Globally, economic production is dominated by services, followed by industry and agriculture.
World GDP PPP Statistics by Year
| Year | GDP, Purchasing Power Parity (PPP) |
| 2000 | 49,551.0 |
| 2001 | 51,969.7 |
| 2002 | 54,495.8 |
| 2003 | 57,572.4 |
| 2004 | 62,263.6 |
| 2005 | 67,109.3 |
| 2006 | 73,510.8 |
| 2007 | 79,616.1 |
| 2008 | 84,328.9 |
| 2009 | 85,076.7 |
| 2010 | 90,691.5 |
| 2011 | 96,699.4 |
| 2012 | 101,820.0 |
| 2013 | 106,959.6 |
| 2014 | 111,185.1 |
| 2015 | 113,744.1 |
| 2016 | 118,498.7 |
| 2017 | 125,145.5 |
| 2018 | 133,162.2 |
| 2019 | 141,087.9 |
| 2020 | 140,690.3 |
| 2021 | 157,278.7 |
| 2022 | 175,652.5 |
| 2023 | 188,531.0 |
| 2024 | 199,686.1 |
| 2025 (Est.) | 207,000.0 |
| 2026 (Est.) | 215,000.0 |