
Uzbekistans PPP GDP was $335.2 billion in 2023. Agriculture, gas, and services dominate, with GDP per capita (PPP) at $9,700. Reforms boost trade, but poverty and infrastructure deficits remain. Mining and tourism offer growth potential. See all Uzbekistan economy graphs.
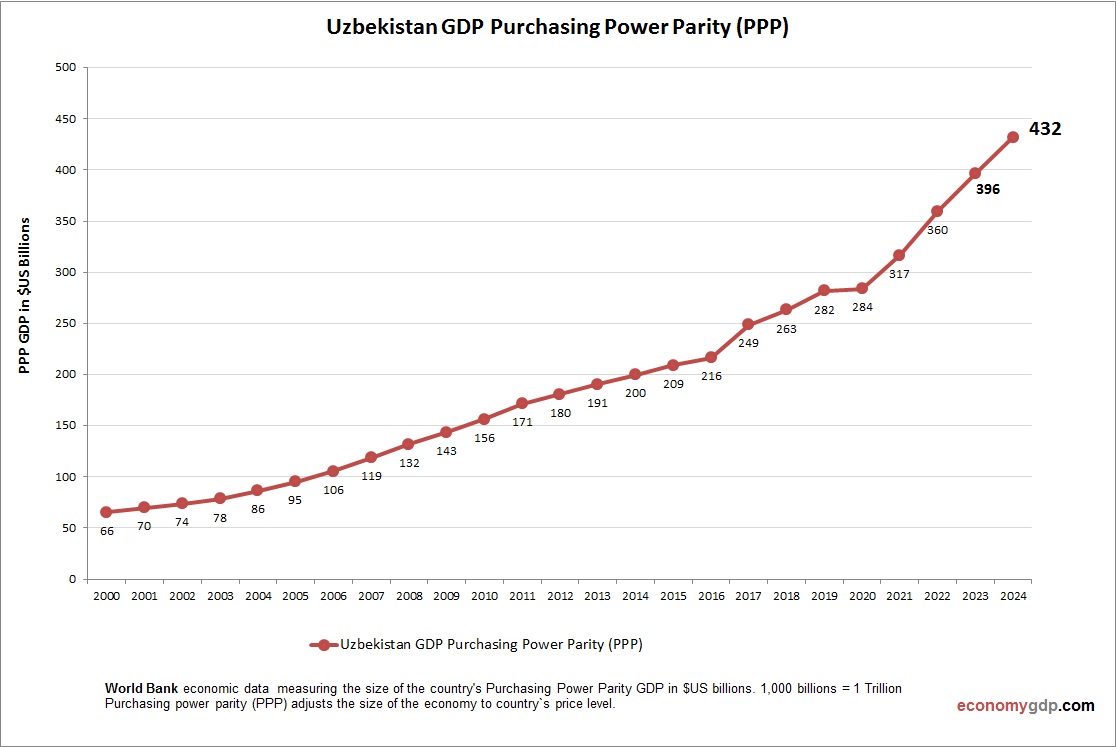
Uzbekistan GDP PPP Statistics by Year
| Year | GDP, Purchasing Power Parity (PPP) |
| 2000 | 65.5 |
| 2001 | 69.8 |
| 2002 | 73.7 |
| 2003 | 78.3 |
| 2004 | 86.4 |
| 2005 | 95.4 |
| 2006 | 105.6 |
| 2007 | 118.8 |
| 2008 | 132.0 |
| 2009 | 143.5 |
| 2010 | 156.3 |
| 2011 | 171.5 |
| 2012 | 180.5 |
| 2013 | 190.6 |
| 2014 | 199.8 |
| 2015 | 209.1 |
| 2016 | 216.5 |
| 2017 | 248.8 |
| 2018 | 263.2 |
| 2019 | 281.7 |
| 2020 | 283.9 |
| 2021 | 316.7 |
| 2022 | 359.6 |
| 2023 | 396.0 |
| 2024 | 431.9 |
| 2025 (Est.) | 470.0 |
| 2026 (Est.) | 510.0 |