
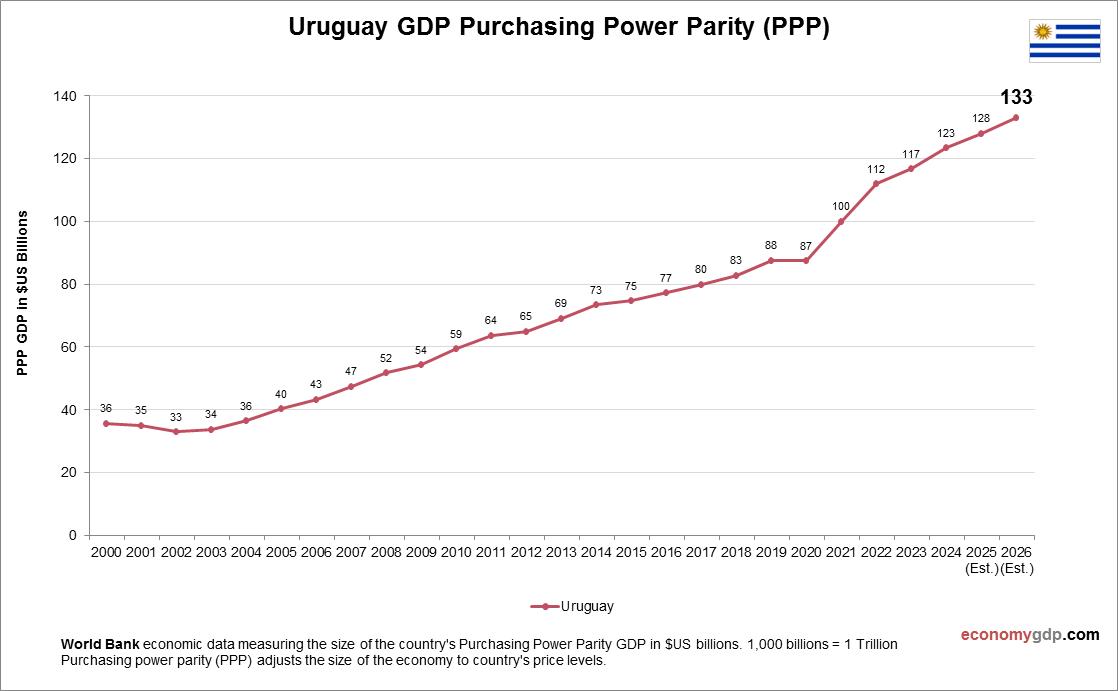
Uruguays PPP GDP was $95.7 billion in 2023. Agriculture (beef, soy) and services drive growth, with GDP per capita (PPP) at $27,800. Stable governance supports trade, but reliance on commodities poses risks. Renewable energy is a growing sector.
Uruguay GDP PPP Statistics by Year
| Year | GDP, Purchasing Power Parity (PPP) |
| 2000 | 35.7 |
| 2001 | 35.1 |
| 2002 | 32.9 |
| 2003 | 33.8 |
| 2004 | 36.5 |
| 2005 | 40.4 |
| 2006 | 43.4 |
| 2007 | 47.4 |
| 2008 | 51.8 |
| 2009 | 54.4 |
| 2010 | 59.3 |
| 2011 | 63.7 |
| 2012 | 65.0 |
| 2013 | 69.1 |
| 2014 | 73.4 |
| 2015 | 74.7 |
| 2016 | 77.2 |
| 2017 | 80.0 |
| 2018 | 82.8 |
| 2019 | 87.6 |
| 2020 | 87.4 |
| 2021 | 100.0 |
| 2022 | 111.9 |
| 2023 | 116.8 |
| 2024 | 123.3 |
| 2025 (Est.) | 128.0 |
| 2026 (Est.) | 133.0 |