Skip to content
cropped-economygdp.jpg

Economy GDP

World economy charts, business frameworks and diagrams

Menu

Primary menu

  • Economy
    • Top Economies
  • Demographics
  • Business
    • Strategy
    • Project Management
    • Industry Examples
    • Leadership
    • HR
    • Industry Examples
  • Framework
  • Analysis
  • Lean Six Sigma
    • Lean
  • IT
    • Social Media
  • Marketing
  • Stories
  • Top

Tag Archives: Ethiopia statistics

Ethiopia GDP Purchasing Power Parity

Ethiopia GDP Purchasing Power Parity

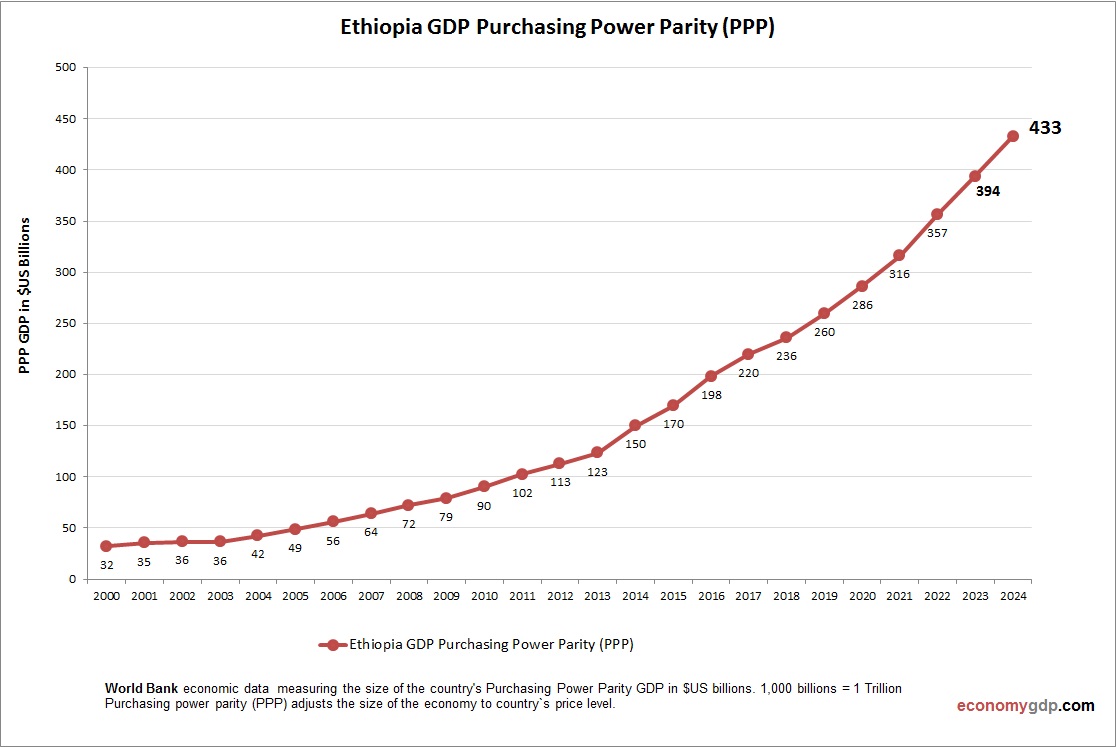
Ethiopia’s GDP (PPP) is estimated at $347.6 billion in 2025. Ethiopia’s economy relies on agriculture (coffee, teff), with manufacturing and services growing. The PPP adjustment significantly boosts GDP due to a low cost of living. Rapid growth is driven by View diagram Ethiopia GDP Purchasing Power Parity→

Posted in Economy | Tagged Ethiopia, Ethiopia economy, Ethiopia GDP, Ethiopia statistics

Ethiopia Fertility Rate

Ethiopia Fertility Rate

Chart above demonstrates Ethiopia Fertility Rate. This is according to World Bank birth stats by country. Based on the latest available information for Ethiopia. Ethiopia’s fertility rate is high, though it has begun to decline. Government family planning efforts and View diagram Ethiopia Fertility Rate→

Posted in Demographics | Tagged Ethiopia demographics, Ethiopia statistics

Ethiopia GDP PPP

Ethiopia GDP PPP

Ethiopia’s PPP GDP was $393.3 billion in 2023. Agriculture, manufacturing, and services drive growth, with GDP per capita (PPP) at $3,100. Rapid urbanization and infrastructure projects support prospects, but conflict and debt challenges persist. Agricultural reforms are critical for sustainability. View diagram Ethiopia GDP PPP→

Posted in Economy | Tagged Ethiopia, Ethiopia statistics

Ethiopia Children Per woman

Ethiopia Children Per woman

The above graph shows Ethiopia Children Per woman. This is according to World Bank birth stats by country. Latest births per woman information for Ethiopia. Ethiopia’s fertility rate is gradually decreasing but remains relatively high due to traditional norms, rural View diagram Ethiopia Children Per woman→

Posted in Demographics | Tagged Ethiopia demographics, Ethiopia statistics

Primary Sidebar Widget Area

Top Diagrams

Latest Posts

  • Papua New Guinea Inflation
  • Bangladesh’s Economy – Built on T-Shirts and Money Sent Home
  • Business Capabilities Model Described
  • Zambia Economy
  • Time Management Strategy
  • The Philippines’ Economy – Run on Remittances and Call Centres
  • Steps in Agile Methodology Illustration
  • Mauritius GDP PPP
  • Malaysia’s Economy – Packaging the World’s Chips
  • Malta Inflation
  • St. Lucia Children Per woman
  • Thailand’s Economy – Chips Up, Tourists Down
  • Equatorial Guinea GDP per capita
  • The UAE’s Economy – The Oil State That Outgrew Oil
  • Vanuatu GDP
  • Twitter
Copyright © 2026 Economy GDP. All Rights Reserved.
Theme: Catch Box by Catch Themes
Scroll Up