
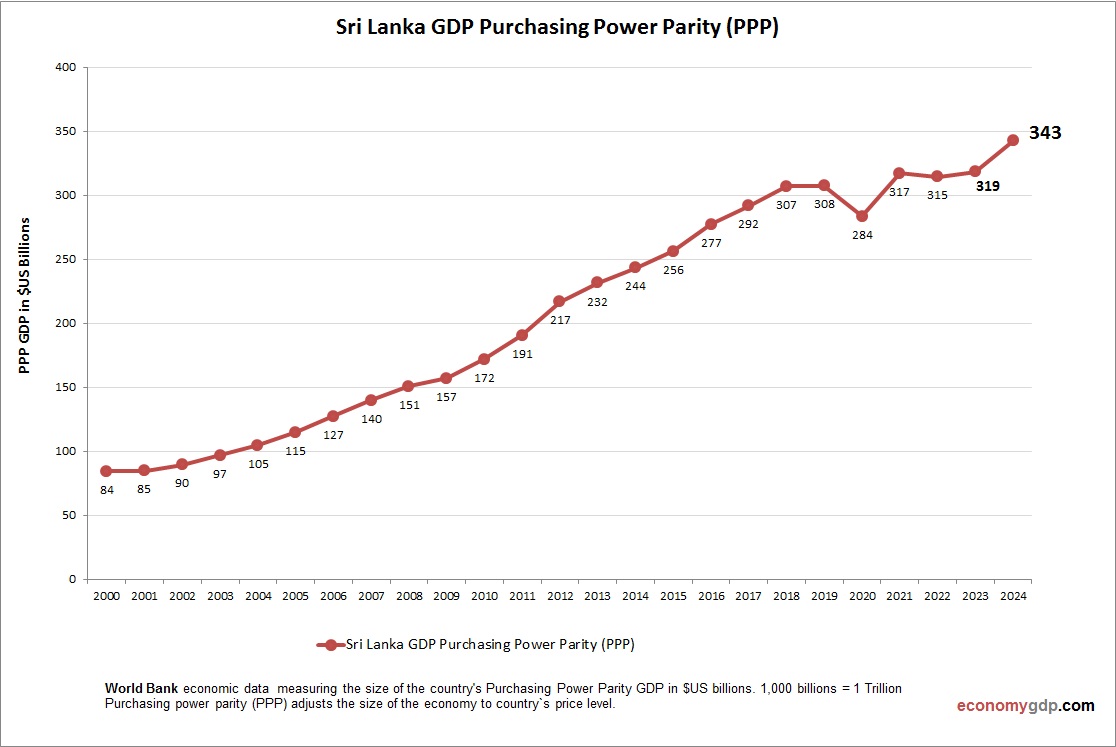
Sri Lankas PPP GDP was $322.8 billion in 2023. Agriculture, tourism, and services drive growth, with GDP per capita (PPP) at $14,800. Political instability and debt challenge progress, though trade supports recovery. Renewable energy and tech are emerging.
Sri Lanka GDP PPP Statistics by Year
| Year | GDP, Purchasing Power Parity (PPP) |
| 2000 | 84.3 |
| 2001 | 84.8 |
| 2002 | 89.6 |
| 2003 | 96.8 |
| 2004 | 104.8 |
| 2005 | 114.8 |
| 2006 | 127.4 |
| 2007 | 139.8 |
| 2008 | 150.9 |
| 2009 | 157.2 |
| 2010 | 171.9 |
| 2011 | 190.7 |
| 2012 | 217.0 |
| 2013 | 231.6 |
| 2014 | 243.5 |
| 2015 | 256.4 |
| 2016 | 277.4 |
| 2017 | 292.0 |
| 2018 | 307.2 |
| 2019 | 307.7 |
| 2020 | 283.7 |
| 2021 | 317.2 |
| 2022 | 314.8 |
| 2023 | 318.6 |
| 2024 | 342.6 |
| 2025 (Est.) | 360.0 |
| 2026 (Est.) | 380.0 |