
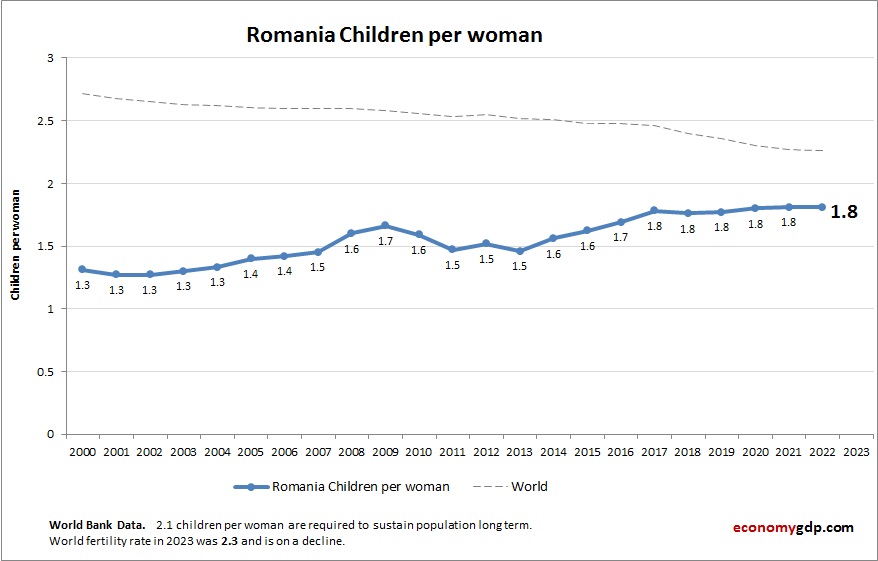
This diagram presents Romania Children Per woman. World Bank is the source of this birth data. Based on the latest available information for Romania.
Romania has a low children per woman rate. Emigration, delayed childbearing, and economic instability have led to a shrinking and aging population.
Romania Children Per woman (Fertility Rate) Statistics by Year
| Year | Children per woman (fertility rate) |
| 2000 | 1.31 |
| 2001 | 1.27 |
| 2002 | 1.27 |
| 2003 | 1.30 |
| 2004 | 1.33 |
| 2005 | 1.40 |
| 2006 | 1.42 |
| 2007 | 1.45 |
| 2008 | 1.60 |
| 2009 | 1.66 |
| 2010 | 1.59 |
| 2011 | 1.47 |
| 2012 | 1.52 |
| 2013 | 1.46 |
| 2014 | 1.56 |
| 2015 | 1.62 |
| 2016 | 1.69 |
| 2017 | 1.78 |
| 2018 | 1.76 |
| 2019 | 1.77 |
| 2020 | 1.80 |
| 2021 | 1.81 |
| 2022 | 1.71 |
| 2023 | 1.54 |
| 2024 | 1.39 |
| 2025 (Est.) | 1.38 |
| 2026 (Est.) | 1.37 |