
Skip to content
cropped-economygdp.jpg

Economy GDP

World economy charts, business frameworks and diagrams

Menu

Primary menu

  • Economy
    • Top Economies
  • Demographics
  • Business
    • Strategy
    • Project Management
    • Industry Examples
    • Leadership
    • HR
    • Industry Examples
  • Framework
  • Analysis
  • Lean Six Sigma
    • Lean
  • IT
    • Social Media
  • Marketing
  • Stories
  • Top

Habits of productive people diagram

Habits of productive people diagram
How To Be Productive – 22 Habits Of Highly Productive People 1 Stop multitasking 2 Use the Pomodoro Technique 3 Prioritize your to-do list 4 Apply the 80/20 rule 5 Wake up early 6 Do the worst task first 7 View diagram Habits of productive people diagram→

Posted in Business, Leadership | Tagged leadership diagram

Problem analysis diagram

Problem analysis diagram

Root Cause Analysis diagram is used to analyze the root causes of factors that influence the problem. It helps to identify the root causes for a factor and then propose possible corrective actions. A diagram is constructed separately for each View diagram Problem analysis diagram→

Posted in Analysis, Business, Lean Six Sigma | Tagged analysis framework, business analysis, business analysis example

SMART Goals Examples Good vs Bad

SMART Goals Examples Good vs Bad

Bad Examples of Smart Goals. Here are some goal statements that aren’t good smart goal examples… “I want to look great.”. “I want to lose weight.”. “I want to lose 20 pounds.”. “I don’t want to be overweight anymore. “I View diagram SMART Goals Examples Good vs Bad→

Posted in Business, Leadership | Tagged leadership diagram

Risk Assessment Matrix

Risk Assessment Matrix

A risk assessment matrix simplifies the information from the risk assessment form, making it easier to pinpoint major threats in a single glance. This convenience makes it a key tool in the risk management process. Every risk assessment matrix has View diagram Risk Assessment Matrix→

Posted in Business, Risk Management | Tagged risk management

Waterfall vs agile project

Waterfall vs agile project

The waterfall is a structured and rigid methodology whereas the Agile methodology is popular for its flexibility. Waterfall management does not allow any changes in between the process, in case there is a mistake, then the project has to start View diagram Waterfall vs agile project→

Posted in Business, Project Management | Tagged agile, agile diagram, agile project

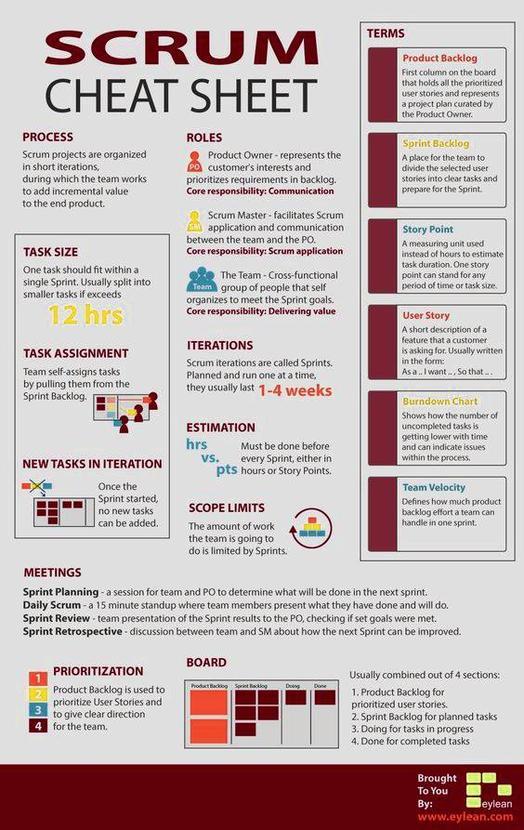
Scrum Cheat Sheet Explained

Scrum Cheat Sheet Explained

Scrum Cheat Sheet 1. Definition Scrum is a frameworkwithin which people can address complex adaptive problems. Scrum is not a methodology, a process or a technique. It’s a framework. Scrum is founded on empirical process control theory, or empiricism. 2. View diagram Scrum Cheat Sheet Explained→

Posted in Business, Project Management | Tagged agile, agile diagram

How to become a great salesman

How to become a great salesman

Find out what your customer really wants and why they want it. People buy “things” as a means to an end. Understanding your customer’s desires and adopting them yourself will make you a great salesman. Allow your customer to lead View diagram How to become a great salesman→

Posted in Business, Leadership | Tagged leadership diagram

Warehouse Management Infographic

Warehouse Management Infographic
Posted in Business, Lean Six Sigma

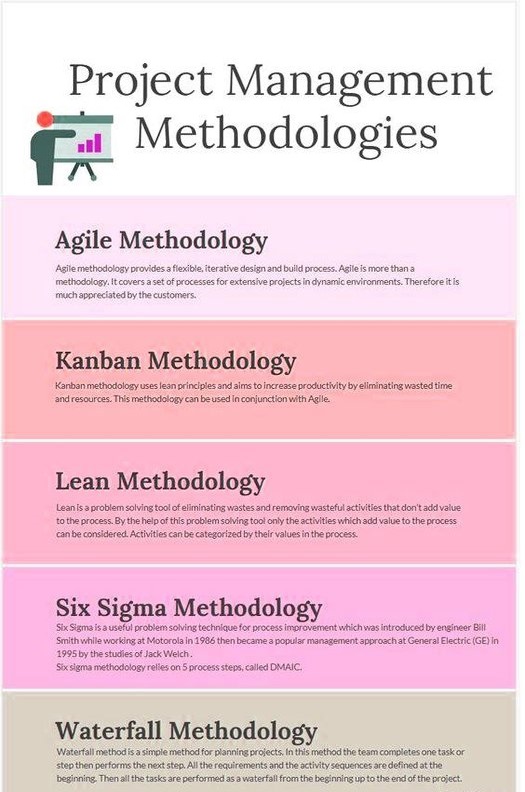
Project Management Methodologies

Project Management Methodologies

These are different project management methodologies. The diagram depicts methodolies including waterfall, agile, lean and others. These project management methodologies will help your project to be on time, within budget and within scope.

Posted in Project Management | Tagged project management

DMAIC tools for each phase

DMAIC tools for each phase

DMAIC Phase Tools Used: Define – Define project goals and customer deliverables, develop Problem Statement, Goals and Benefits; Identify Process Owner and Team Members; Define Resources; Develop Project Plan and Key Milestones By using Lean Six Sigma DMAIC approach, companies View diagram DMAIC tools for each phase→

Posted in Lean | Tagged dmaic

Post navigation

← Older posts
Newer posts →

Primary Sidebar Widget Area

Top Diagrams

Latest Posts

  • Nicaragua GDP per capita
  • Poland’s Economy – The Newest Member of the $1 Trillion Club
  • Ways to Make Money Fast Illustration
  • Business Model Framework Sample
  • North America Children Per woman
  • Turkey’s Economy – A $1.6 Trillion Economy That Can’t Shake Inflation
  • Mozambique Economy
  • Bulgaria Inflation
  • Saudi Arabia’s Economy – The Oil Giant Trying to Outgrow Oil
  • Suriname Children Per woman
  • Architecture Diagram for Salesforce Trailhead
  • Switzerland’s Economy – Small Country, Enormous Paycheck
  • Zambia GDP
  • Liechtenstein GDP PPP
  • Turkmenistan Economy
  • Twitter
Copyright © 2026 Economy GDP. All Rights Reserved.
Theme: Catch Box by Catch Themes
Scroll Up