Ansoff Matrix Framework

Ansoff Matrix Framework

Ansoff matrix helps companies make strategic decisions based on whether market and product are either new or existing. New Market, new product calls for diversification strategy. Existing market, existing product requires market penetration strategy. Existing product, new market needs market View diagram Ansoff Matrix Framework→

Simplex Diagram

Simplex Diagram

Lean six sigma simplex model is a method of analyzing and fixing problems starting with problem finding, fact finding, problem definition, idea finding, selection, planning, sell idea, action. The simplex cycle repeats. The below diagram explains the simplex method.

Lean six sigma belts pyramid

Lean six sigma belts pyramid

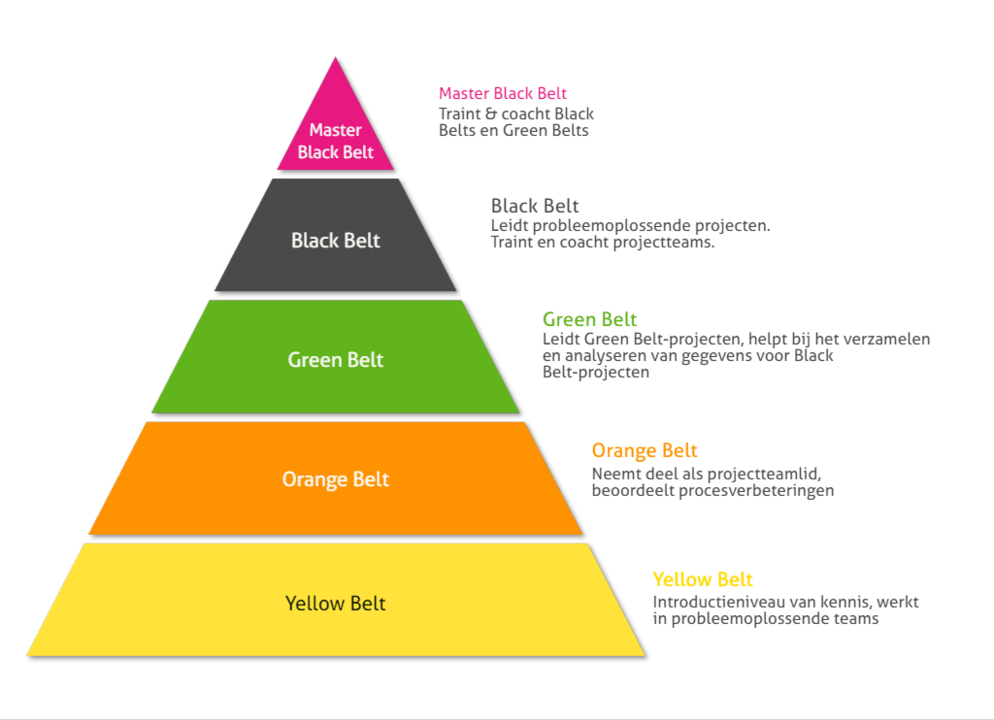
Lean six sigma diagram explaining lss belts progression from yellow belt to master black belt. The pyramid shows the belts one must go through to achieve lean six sigma designation.

LSS Histogram

LSS Histogram

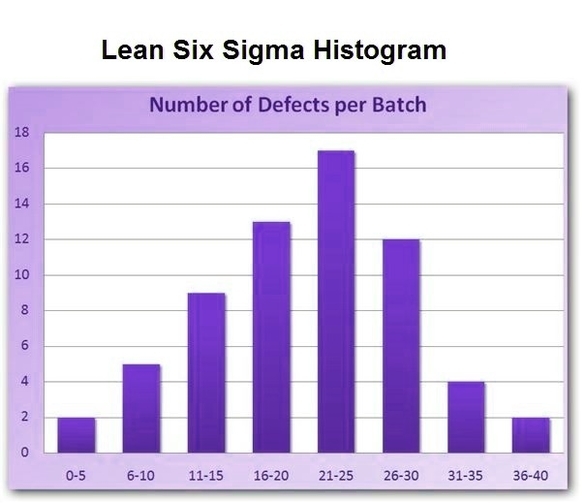
A sample lss histogram below shows number of defects per batch. Lean six sigma histograms are a good graphic representation of various data points such as defects widely used by the lss methodology.

Push vs pull system

Push vs pull system

Push vs pull system diagram below explains the difference between two key lean six sigma process types. Push system is when material is pushed into downstream workstations regardless of whether resources are available. Pull system – materials are pulled to View diagram Push vs pull system→

Product analysis

Product analysis

Product analysis diagram below helps you compare various products among key parameters including client satisfaction, quality, price, and lead time to get the product. You may have a product score high in one criteria (e.g. quality) but score low on View diagram Product analysis→