East Asia and Pacific (excluding high income) GDP PPP
East Asia and Pacific (excluding high income) economy graph showing purchasing power parity (PPP) growth from 1990 to today. Purchasing power parity adjusts the size of the economy to relevant price levels, i.e. measuring the price of specific goods in View diagram East Asia and Pacific (excluding high income) GDP PPP
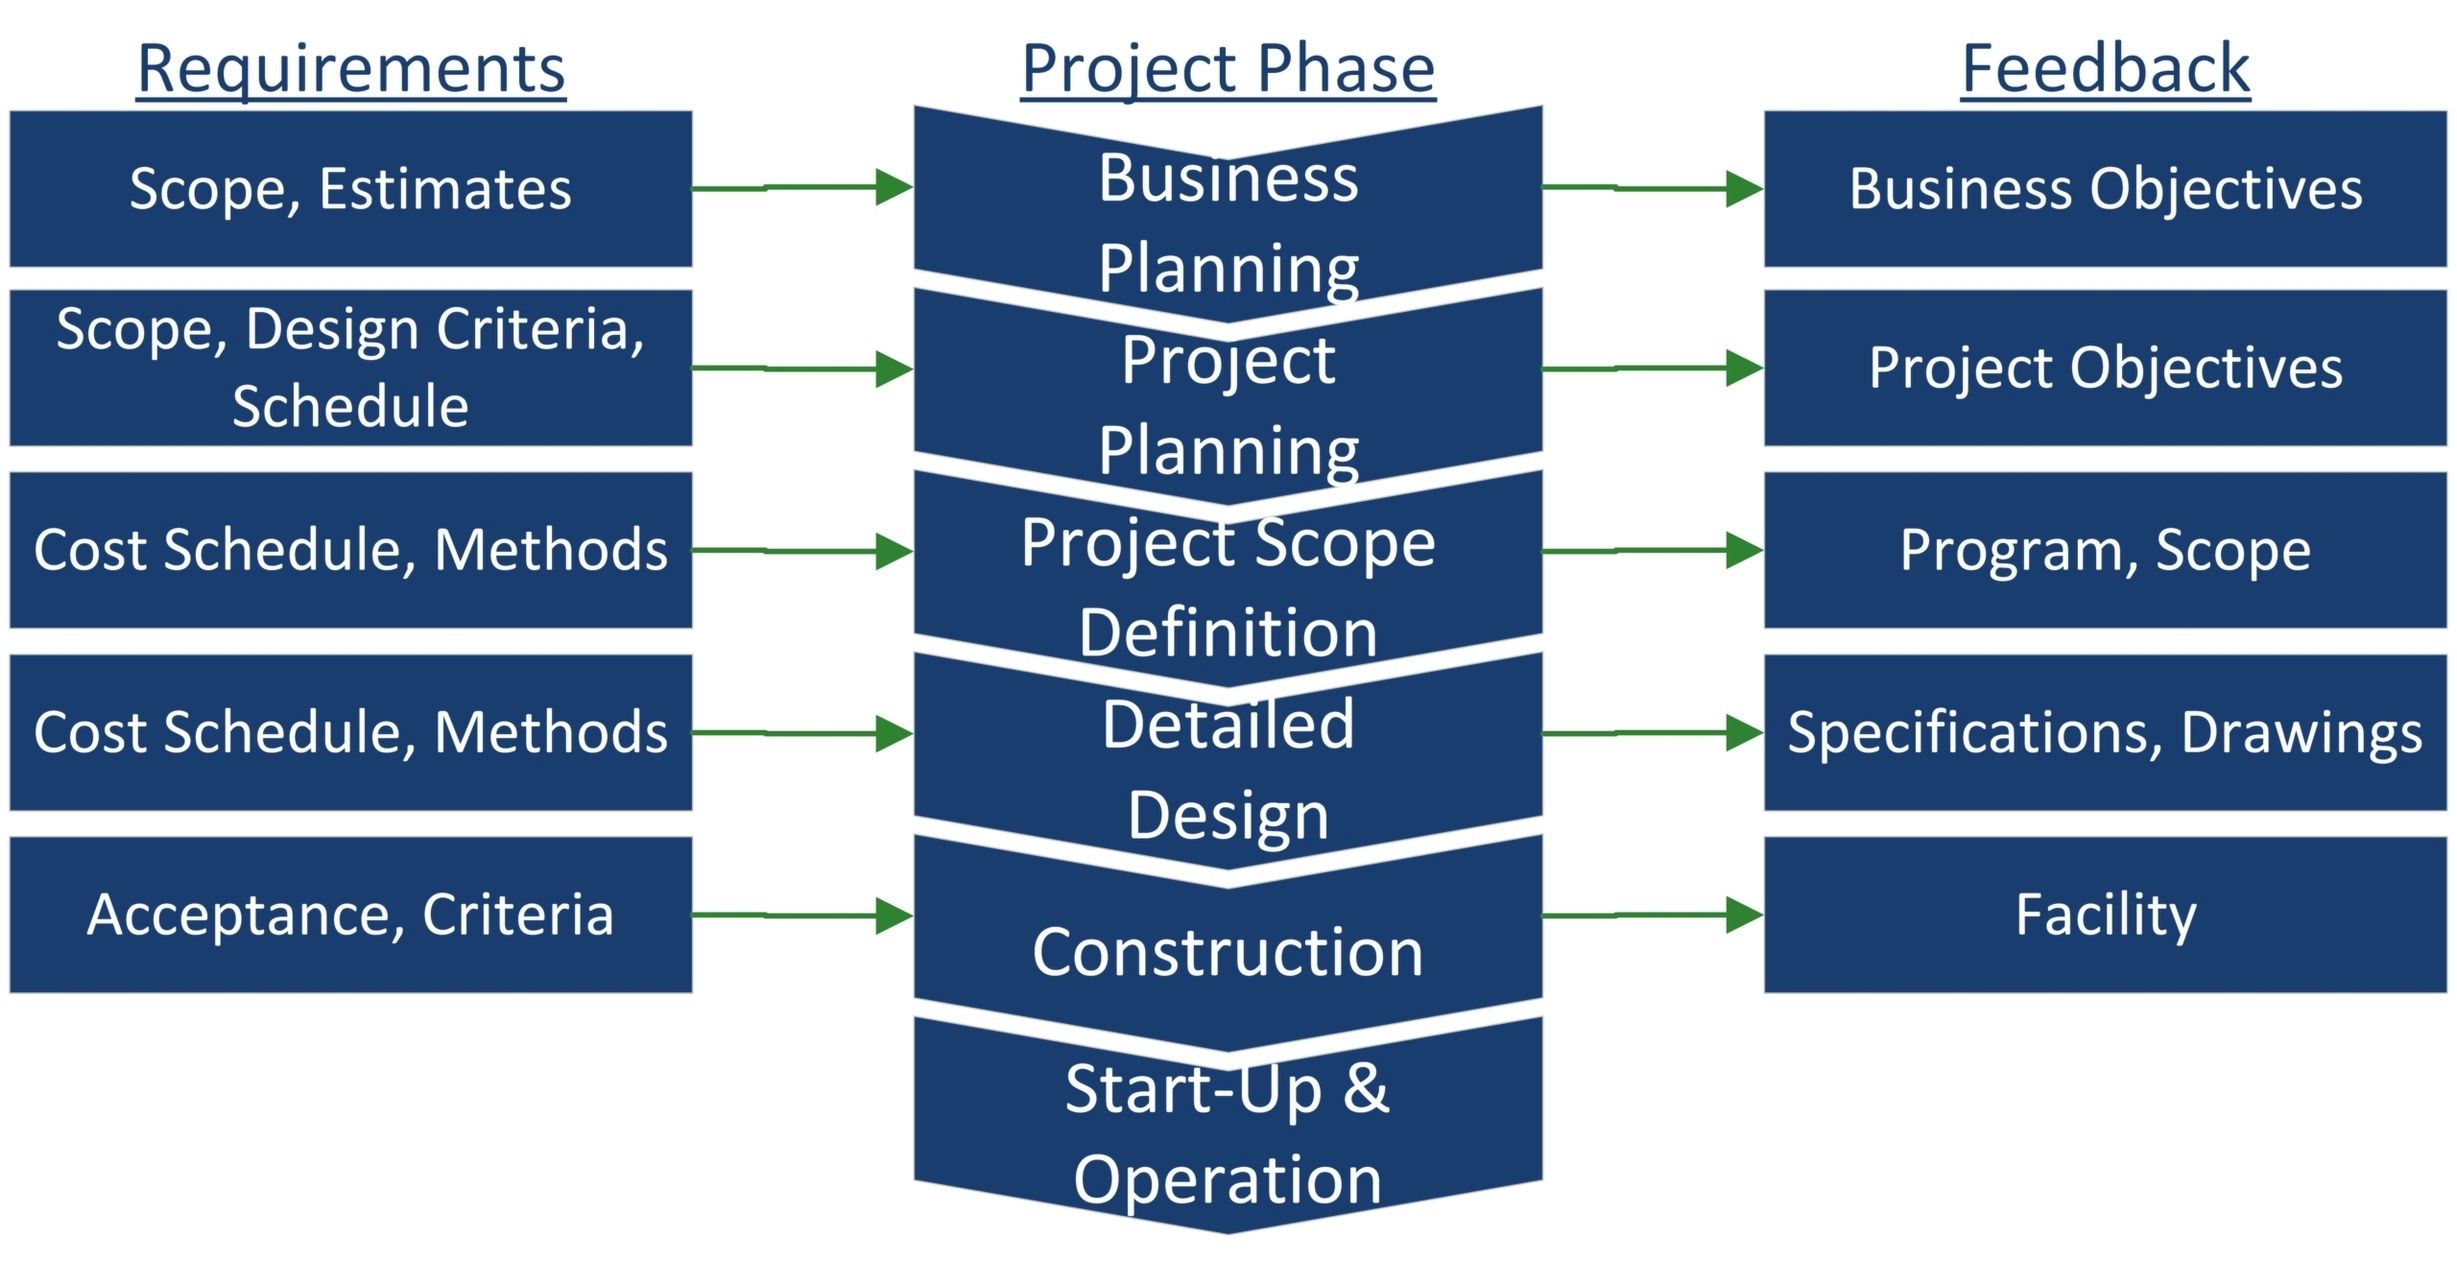
Project Management Requirements By Phase
The Project Management Body of Knowledge (PMBOK) organizes project phases according to their life cycle, starting with Project Initiation and ending in Project Closure. The five phases of project management are: 1. Project Initiation: This phase is where the project View diagram Project Management Requirements By Phase
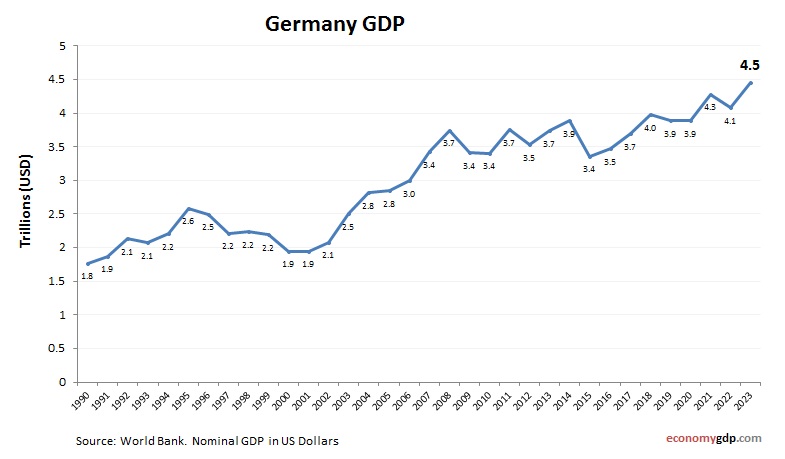
Germany GDP
Germany GDP from 2010 to today. World Bank and OECD data. GDP in US dollars. Germany's GDP is Europe's largest, built on advanced manufacturing, exports, and innovation. Known globally for automobiles, machinery, and chemical industries, Germany is a leader in View diagram Germany GDP
Ukraine GDP growth rate
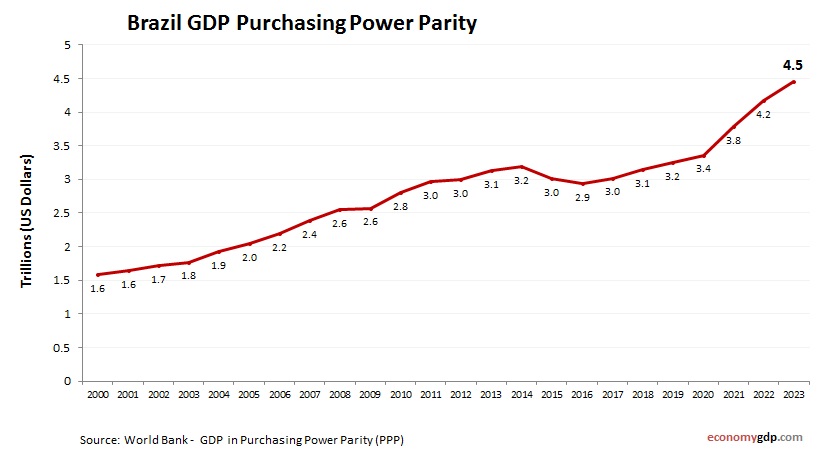
Brazil GDP Purchasing Power Parity
Brazil economy graph showing purchasing power parity (PPP) growth from 2000 to today. Purchasing power parity adjusts the size of the economy to relevant price levels, i.e. measuring the price of specific goods in different countries and adjusting GDP accordingly. View diagram Brazil GDP Purchasing Power Parity
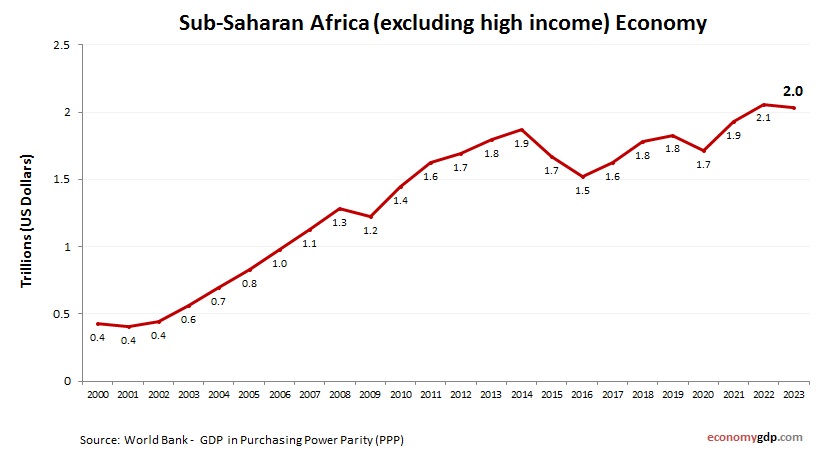
Sub-Saharan Africa (excluding high income) Economy
Sub-Saharan Africa (excluding high income) economy growth from 2000 to today. GDP (current US$). World Bank and OECD national accounts data. This region consists mainly of low and lower-middle-income countries. Economies are agriculture-dependent with growing urban sectors, and efforts are View diagram Sub-Saharan Africa (excluding high income) Economy
Risk Assessment Process Graphics Presentation
Here are some links to web pages that provide information on risk assessment process graphics presentation: 1. The Project Management Institute (PMI) has published an article titled “Visualizing risk management–a new approach” that describes a new approach to visualizing risk View diagram Risk Assessment Process Graphics Presentation
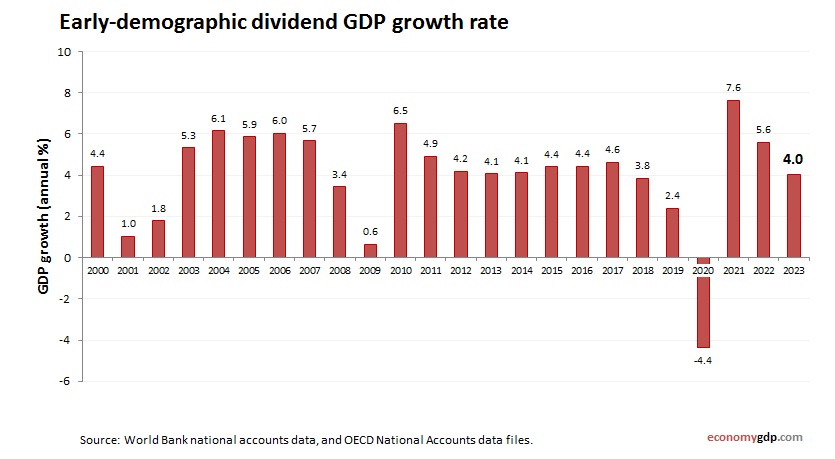
Early-demographic dividend GDP growth rate
Early-demographic dividend economy annual growth rate from 2000 to today. GDP growth (yearly %). World Bank and OECD national accounts data. Countries in the early-demographic dividend phase had a GDP growth rate near 4.8% in 2023. These nations are benefitting View diagram Early-demographic dividend GDP growth rate
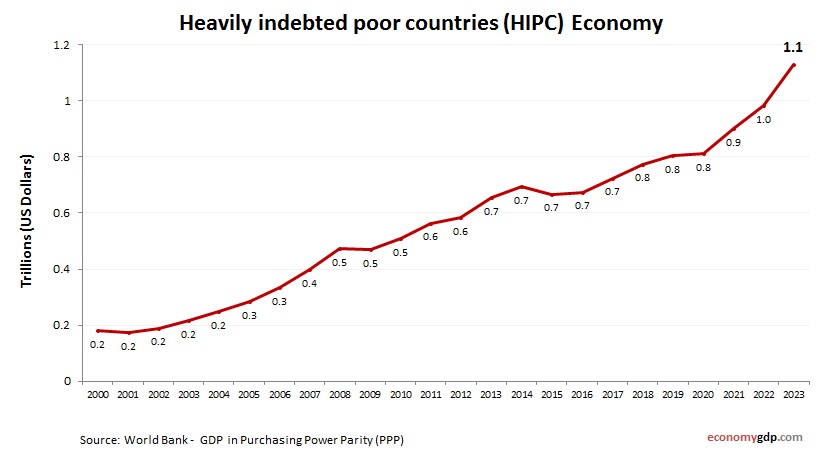
Heavily indebted poor countries (HIPC) Economy
Heavily indebted poor countries (HIPC) economy growth from 2000 to today. GDP (current US$). World Bank and OECD national accounts data. HIPC economies are among the worlds most impoverished, with low GDP, high debt burdens, and reliance on international debt View diagram Heavily indebted poor countries (HIPC) Economy