Skip to content
cropped-economygdp.jpg

Economy GDP

World economy charts, business frameworks and diagrams

Menu

Primary menu

  • Economy
    • Top Economies
  • Demographics
  • Business
    • Strategy
    • Project Management
    • Industry Examples
    • Leadership
    • HR
    • Industry Examples
  • Framework
  • Analysis
  • Lean Six Sigma
    • Lean
  • IT
    • Social Media
  • Marketing
  • Stories
  • Top

Thailand GDP Purchasing Power Parity

Thailand GDP Purchasing Power Parity

Thailand economy graph showing purchasing power parity (PPP) growth from 2000 to today. Purchasing power parity adjusts the size of the economy to relevant price levels, i.e. measuring the price of specific goods in different countries and adjusting GDP accordingly. View diagram Thailand GDP Purchasing Power Parity→

Posted in Economy | Tagged Thailand, Thailand economy, Thailand gdp, Thailand statistics

Sub-Saharan Africa GDP

Sub-Saharan Africa GDP

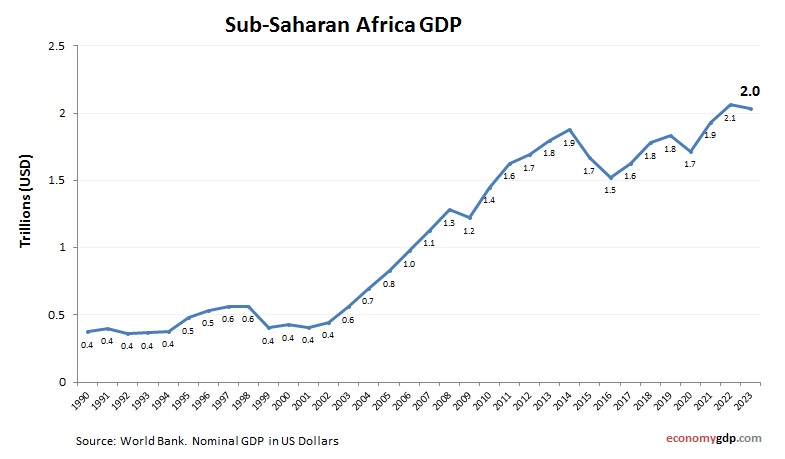
Sub-Saharan Africa GDP from 1990 to today. World Bank and OECD data. GDP in US dollars. Sub-Saharan Africa’s GDP reflects a mix of economies with agriculture, mining, and services at the core. Growth is uneven but improving with investment in View diagram Sub-Saharan Africa GDP→

Posted in Economy | Tagged Sub-Saharan Africa economy, Sub-Saharan Africa gdp

Small states GDP Purchasing Power Parity

Small states GDP Purchasing Power Parity

Small states economy graph showing purchasing power parity (PPP) growth from 2000 to today. Purchasing power parity adjusts the size of the economy to relevant price levels, i.e. measuring the price of specific goods in different countries and adjusting GDP View diagram Small states GDP Purchasing Power Parity→

Posted in Economy

Latin America and the Caribbean (IDA and IBRD countries) GDP Purchasing Power Parity

Latin America and the Caribbean (IDA and IBRD countries) GDP Purchasing Power Parity

Latin America and the Caribbean (IDA and IBRD countries) economy graph showing purchasing power parity (PPP) growth from 2000 to today. Purchasing power parity adjusts the size of the economy to relevant price levels, i.e. measuring the price of specific View diagram Latin America and the Caribbean (IDA and IBRD countries) GDP Purchasing Power Parity→

Posted in Economy

Risk Assessment Process Miller Group6

Risk Assessment Process  Miller Group6

I’m not sure what you are referring to with “miller group6”. However, I can provide you with some information about the risk assessment process. The Treasury Board of Canada Secretariat has published a guide to integrated risk management that provides View diagram Risk Assessment Process Miller Group6→

Posted in Framework

Process Assessment Example

Process Assessment Example

Process assessment is a method of evaluating the process of a task or activity, as well as the product of the task. The process refers to how a learner went about completing a task or achieving an outcome, while the View diagram Process Assessment Example→

Posted in Framework

Poland GDP PPP

Poland GDP PPP

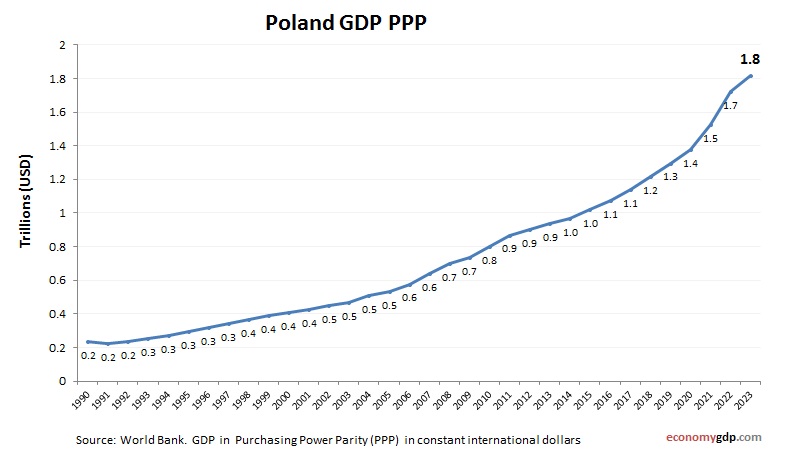
Poland economy graph showing purchasing power parity (PPP) growth from 2000 to today. Purchasing power parity adjusts the size of the economy to relevant price levels, i.e. measuring the price of specific goods in different countries and adjusting GDP accordingly. View diagram Poland GDP PPP→

Posted in Economy | Tagged Poland economy, Poland gdp

Heavily indebted poor countries (HIPC) GDP PPP

Heavily indebted poor countries (HIPC) GDP PPP

Heavily indebted poor countries (HIPC) economy graph showing purchasing power parity (PPP) growth from 1990 to today. Purchasing power parity adjusts the size of the economy to relevant price levels, i.e. measuring the price of specific goods in different countries View diagram Heavily indebted poor countries (HIPC) GDP PPP→

Posted in Economy | Tagged Heavily indebted poor countries (HIPC) economy, Heavily indebted poor countries (HIPC) gdp

Business Startup Checklist For First Time Entrepreneurs

Business Startup Checklist For First Time Entrepreneurs

Starting a business can be an exciting and rewarding venture. Here is a checklist for first-time entrepreneurs to help you get started: 1. Planning a business: Assess your readiness, choose a business structure, conduct market research, and write a business View diagram Business Startup Checklist For First Time Entrepreneurs→

Posted in Framework

Post-demographic dividend GDP growth rate

Post-demographic dividend GDP growth rate

Post-demographic dividend economy annual growth rate from 2000 to today. GDP growth (yearly %). World Bank and OECD national accounts data. Countries in the post-demographic dividend stage experienced a GDP growth rate of about 1.8% in 2023. Aging populations and View diagram Post-demographic dividend GDP growth rate→

Posted in Economy | Tagged Post-demographic dividend economy, Post-demographic dividend gdp

Post navigation

← Older posts
Newer posts →

Primary Sidebar Widget Area

Top Diagrams

Latest Posts

  • Poland’s Economy – The Newest Member of the $1 Trillion Club
  • Ways to Make Money Fast Illustration
  • Business Model Framework Sample
  • North America Children Per woman
  • Turkey’s Economy – A $1.6 Trillion Economy That Can’t Shake Inflation
  • Mozambique Economy
  • Bulgaria Inflation
  • Saudi Arabia’s Economy – The Oil Giant Trying to Outgrow Oil
  • Suriname Children Per woman
  • Architecture Diagram for Salesforce Trailhead
  • Switzerland’s Economy – Small Country, Enormous Paycheck
  • Zambia GDP
  • Liechtenstein GDP PPP
  • Turkmenistan Economy
  • Netherlands Economy – European Logistics Hub
  • Twitter
Copyright © 2026 Economy GDP. All Rights Reserved.
Theme: Catch Box by Catch Themes
Scroll Up