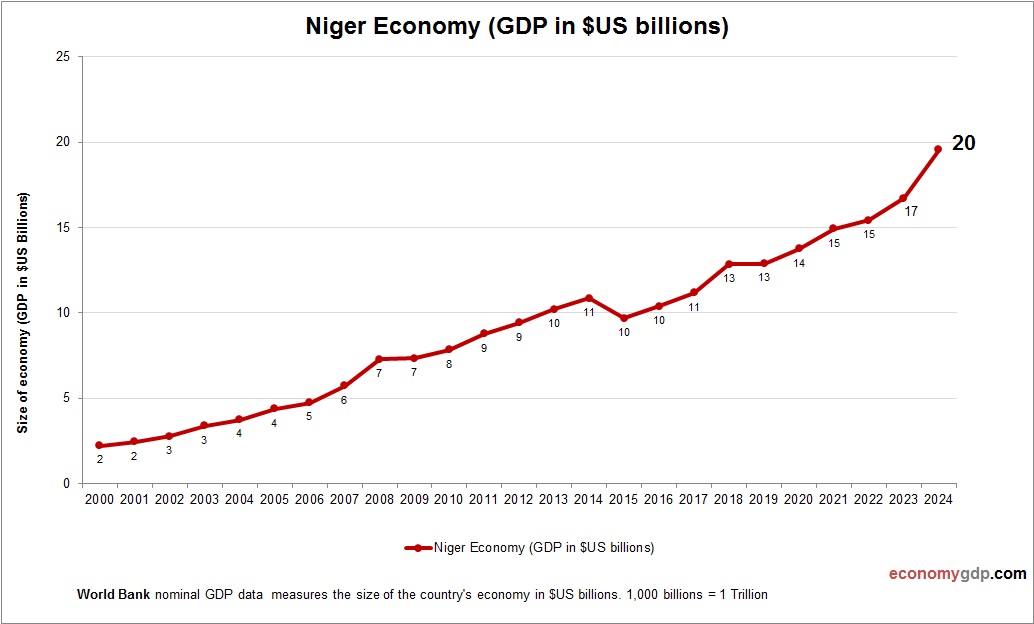
Pre-demographic dividend GDP per capita
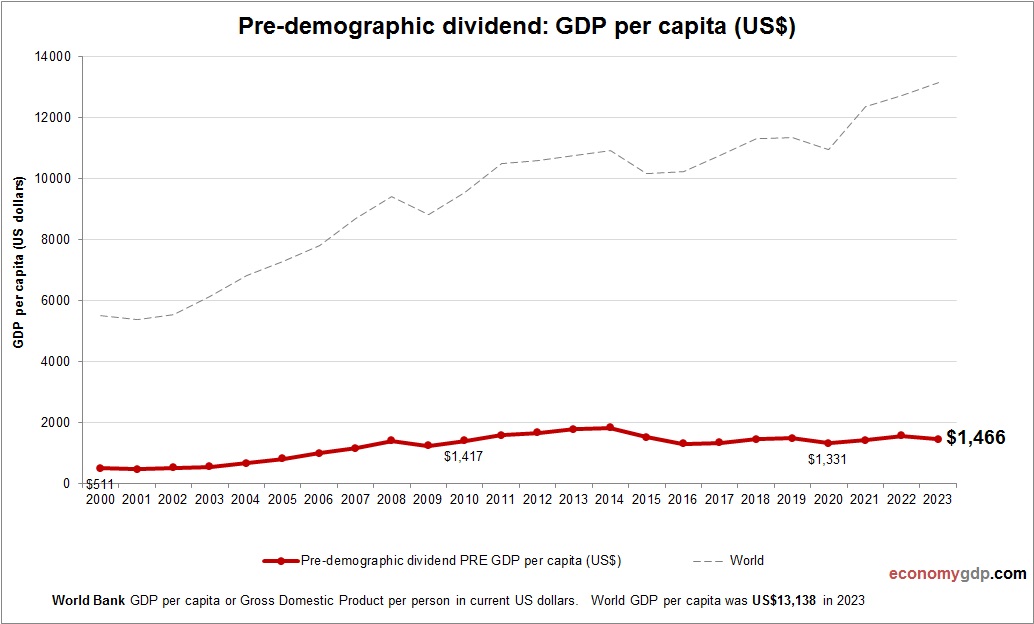
This diagram presents Pre-demographic dividend GDP per capita. The gross domestic product statistics are compiled by World Bank. Based on the latest economic info provided for Pre-demographic dividend.