Free Customer Journey PPT Template Examined Explanation

Free Customer Journey PPT Template Examined Explanation

Free Customer Journey PPT Template Examined Explanation: A free customer journey PPT template examined refers to the process of analyzing the structure and components of a free customer journey template. By examining the template, businesses can understand how it visually View diagram Free Customer Journey PPT Template Examined Explanation→

Uganda GDP per capita

Uganda GDP per capita

This diagram presents Uganda GDP per capita. The economic data is provided by World Bank. Based on the latest available information for Uganda. Uganda’s GDP per capita in 2024 is estimated at approximately $1,000. The economy is largely dependent on View diagram Uganda GDP per capita→

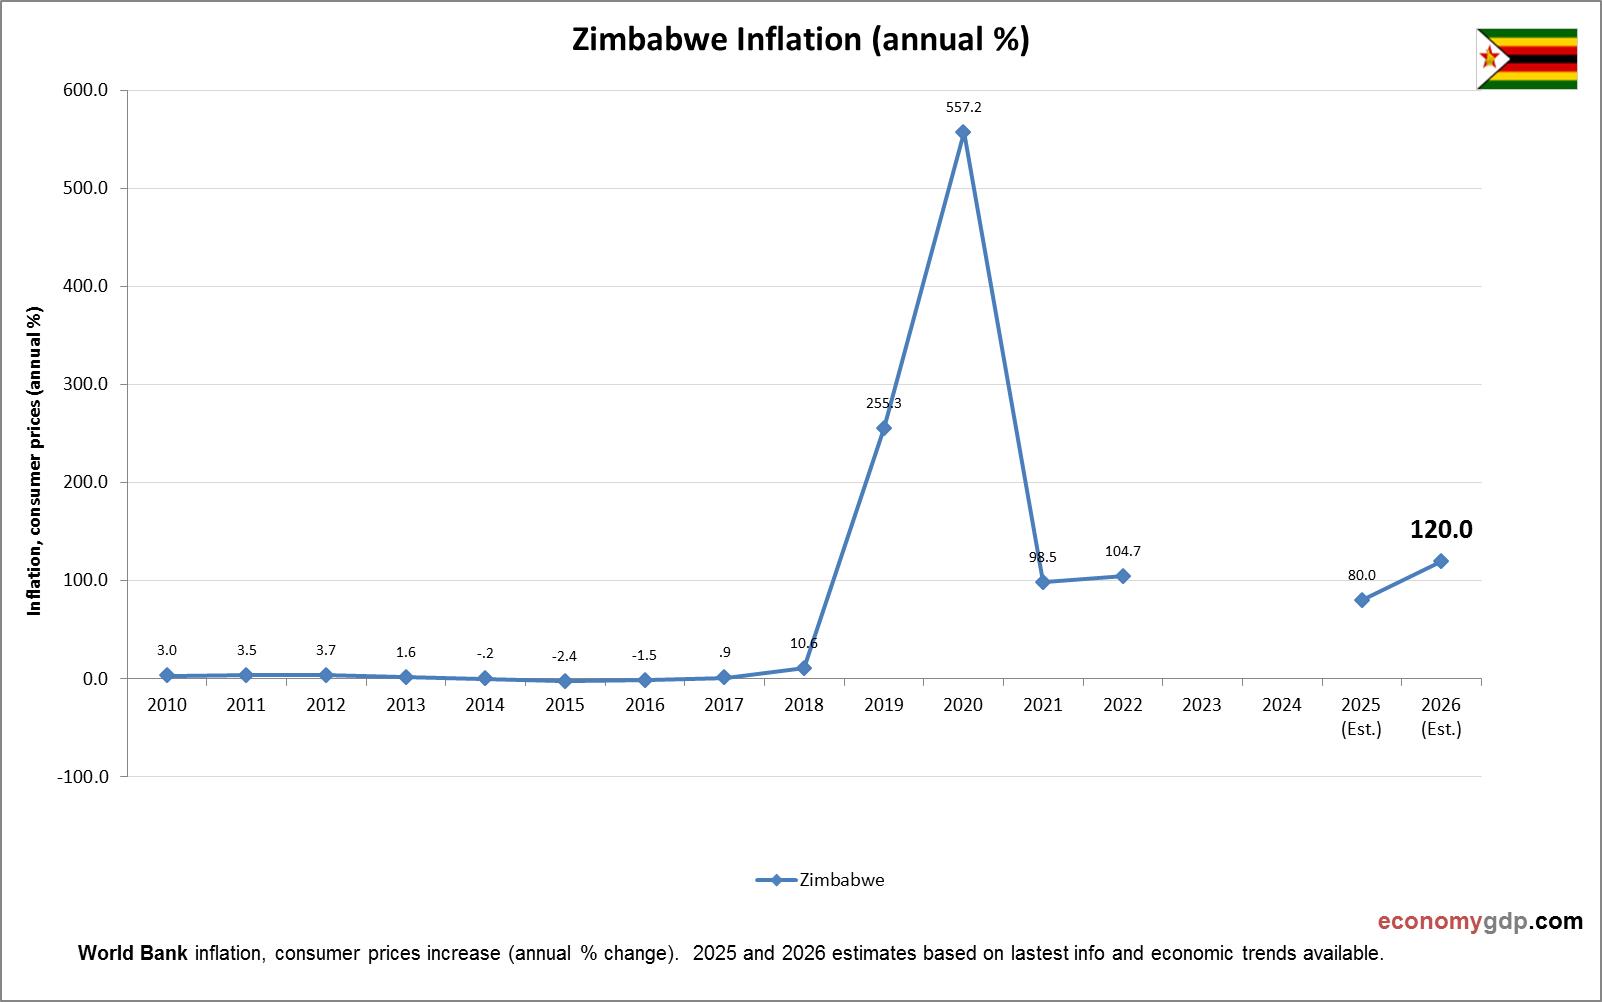
Zimbabwe Inflation

Zimbabwe Inflation

This diagram presents Zimbabwe Inflation. Inflation data is sourced from World Bank. Based on the latest economic data provided for Zimbabwe. Zimbabwe experiences chronic hyperinflation due to currency instability, weak governance, and shortages of foreign currency. Import dependency and agricultural View diagram Zimbabwe Inflation→

End Of Gold Standard And Floating Exchange Rates

The Bretton Woods collapse in 1971 ended the gold standard, introducing floating exchange rates. This shift gave countries more flexibility in monetary policy but also ushered in new challenges of currency volatility and inflation control.

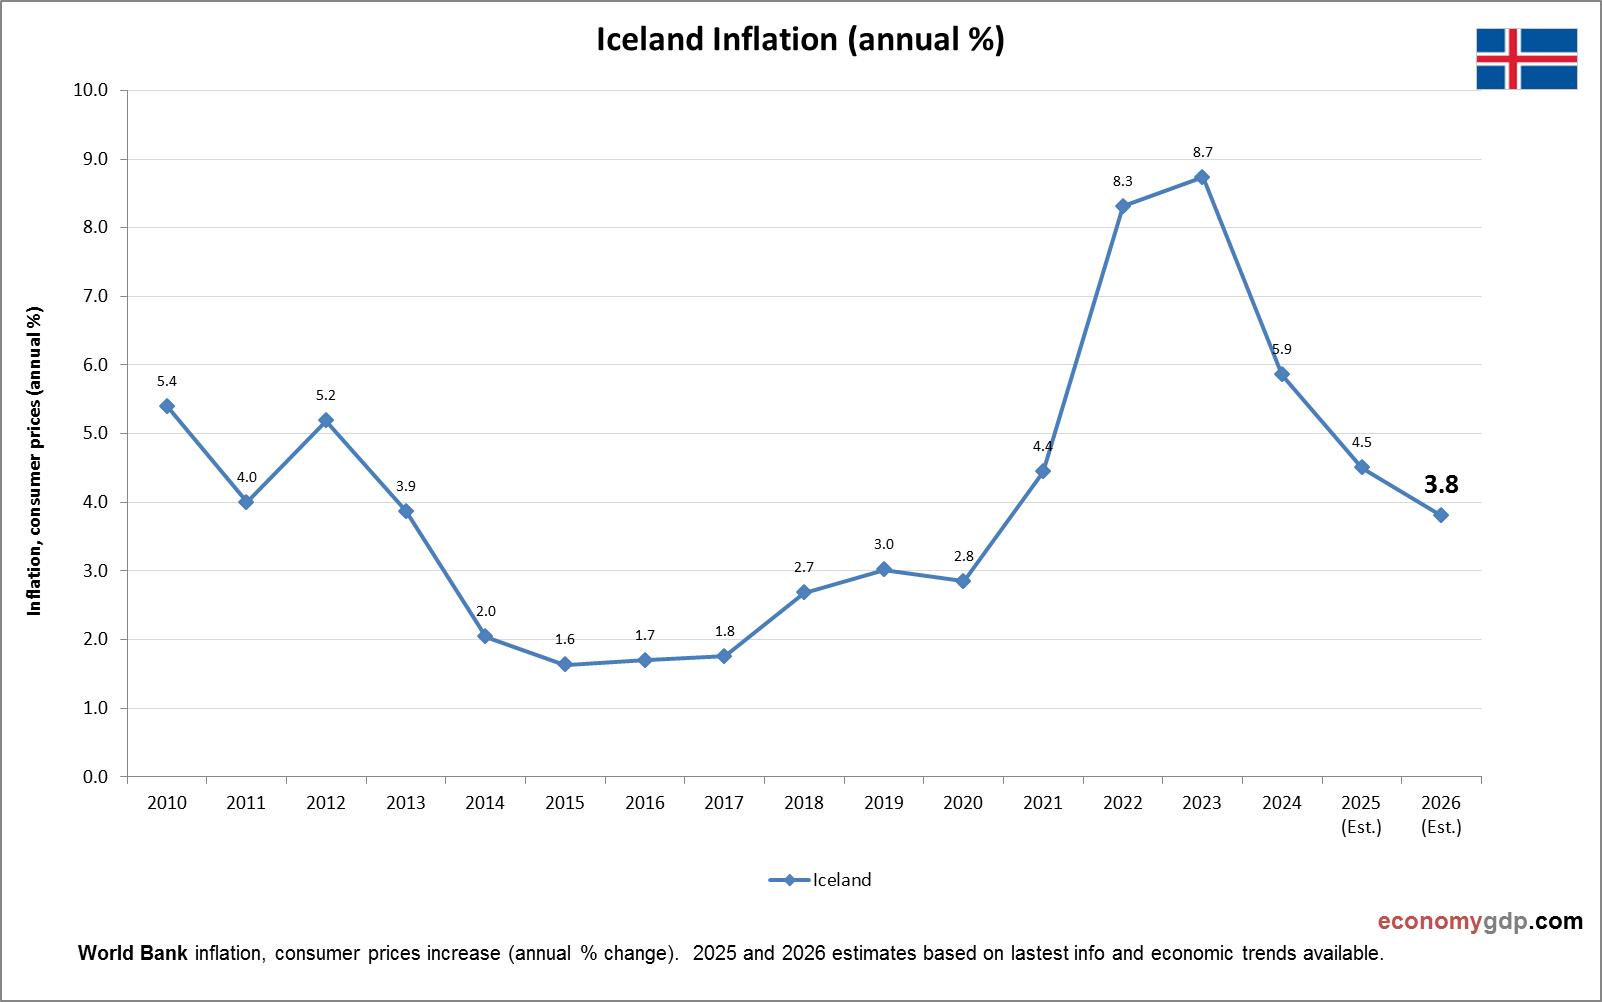
Iceland Inflation

Iceland Inflation

This chart demonstrates Iceland Inflation. Inflation data is sourced from World Bank. Based on the latest available information for Iceland. Iceland experiences inflation due to energy prices, a small domestic market, and tourism-driven demand pressures affecting housing and services.