
Surinames PPP GDP was $10.9 billion in 2023. Mining (bauxite, gold) and agriculture dominate, with GDP per capita (PPP) at $17,200. Political instability and debt pose risks, though oil discoveries offer potential. Infrastructure investment is essential.
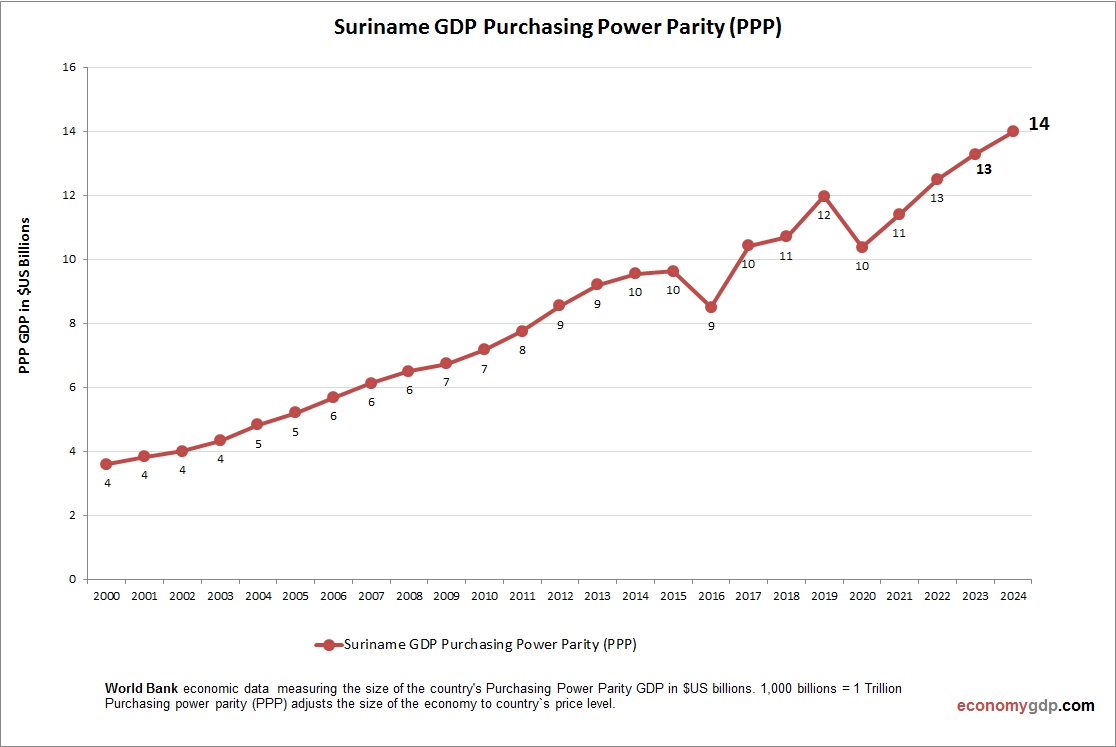
Suriname GDP PPP Statistics by Year
| Year | GDP, Purchasing Power Parity (PPP) |
| 2000 | 3.6 |
| 2001 | 3.8 |
| 2002 | 4.0 |
| 2003 | 4.3 |
| 2004 | 4.8 |
| 2005 | 5.2 |
| 2006 | 5.7 |
| 2007 | 6.1 |
| 2008 | 6.5 |
| 2009 | 6.7 |
| 2010 | 7.2 |
| 2011 | 7.7 |
| 2012 | 8.5 |
| 2013 | 9.2 |
| 2014 | 9.5 |
| 2015 | 9.6 |
| 2016 | 8.5 |
| 2017 | 10.4 |
| 2018 | 10.7 |
| 2019 | 12.0 |
| 2020 | 10.4 |
| 2021 | 11.4 |
| 2022 | 12.5 |
| 2023 | 13.3 |
| 2024 | 13.8 |
| 2025 (Est.) | 14.5 |
| 2026 (Est.) | 15.2 |