Skip to content
cropped-economygdp.jpg

Economy GDP

World economy charts, business frameworks and diagrams

Menu

Primary menu

  • Economy
    • Top Economies
  • Demographics
  • Business
    • Strategy
    • Project Management
    • Industry Examples
    • Leadership
    • HR
    • Industry Examples
  • Framework
  • Analysis
  • Lean Six Sigma
    • Lean
  • IT
    • Social Media
  • Marketing
  • Stories
  • Top

Tunisia Children Per woman

Tunisia Children Per woman

The above graph shows Tunisia Children Per woman. World Bank is the source of this birth data. Based on the latest demographics info provided for Tunisia. Tunisia has experienced a substantial drop in children per woman over the years, now View diagram Tunisia Children Per woman→

Posted in Demographics | Tagged Tunisia demographics, Tunisia statistics

Equatorial Guinea Fertility Rate

Equatorial Guinea Fertility Rate

Chart above demonstrates Equatorial Guinea Fertility Rate. World Bank is the source of this birth data. Based on the latest demographics info provided for Equatorial Guinea. Equatorial Guinea’s fertility rate is high due to traditional norms and limited reproductive health View diagram Equatorial Guinea Fertility Rate→

Posted in Demographics | Tagged Equatorial Guinea demographics, Equatorial Guinea statistics

Niger Fertility Rate

Niger Fertility Rate

The above graph shows Niger Fertility Rate. This is according to World Bank birth stats by country. Latest births per woman information for Niger. Niger has the highest fertility rate in the world. Early marriage, limited education, and minimal access View diagram Niger Fertility Rate→

Posted in Demographics | Tagged Niger demographics, Niger statistics

Colombia Fertility Rate

Colombia Fertility Rate

This diagram presents Colombia Fertility Rate. World Bank is the source of this birth data. Based on the latest demographics info provided for Colombia. Colombia’s fertility rate is near replacement level. Continued urbanization, higher education access, and modern family planning View diagram Colombia Fertility Rate→

Posted in Demographics | Tagged Colombia demographics, Colombia statistics

Jordan Children Per woman

Jordan Children Per woman

Chart above demonstrates Jordan Children Per woman. World Bank is the source of this birth data. Based on the latest demographics info provided for Jordan. Jordan’s children per woman rate is gradually declining. Rising education levels among women and urban View diagram Jordan Children Per woman→

Posted in Demographics | Tagged Jordan demographics, Jordan statistics

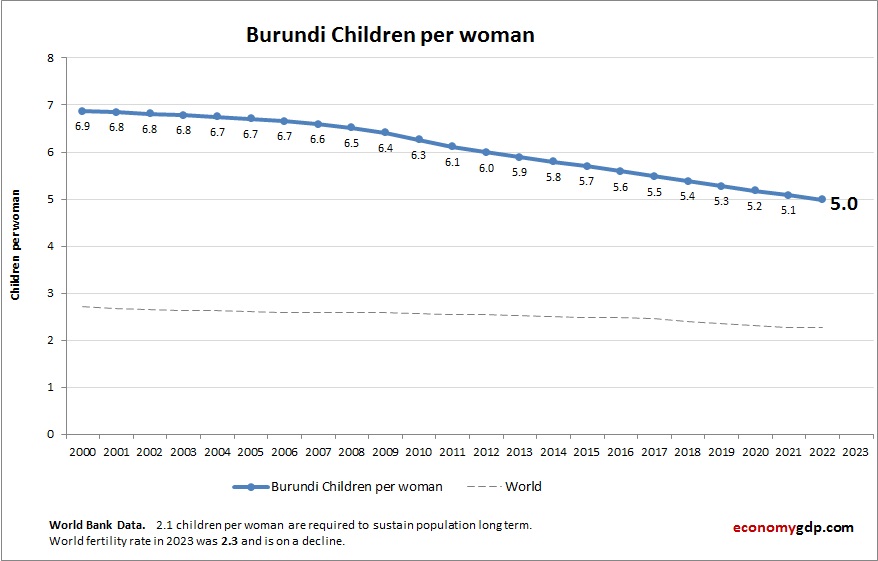
Burundi Children Per woman

Burundi Children Per woman

This diagram presents Burundi Children Per woman. This is according to World Bank birth stats by country. Latest births per woman information for Burundi. Burundi has a high children per woman rate. Traditional values, limited access to healthcare, and high View diagram Burundi Children Per woman→

Posted in Demographics | Tagged Burundi demographics, Burundi statistics

Egypt Fertility Rate

Egypt Fertility Rate

Chart above demonstrates Egypt Fertility Rate. This is according to World Bank birth stats by country. Based on the latest available information for Egypt. Egypt’s fertility rate has been declining but remains relatively high compared to other MENA countries. Economic View diagram Egypt Fertility Rate→

Posted in Demographics | Tagged Egypt demographics, Egypt statistics

Aruba Fertility Rate

Aruba Fertility Rate

The above graph shows Aruba Fertility Rate. The fertility rate statistics are compiled by World Bank. Based on the latest available information for Aruba. Aruba has a low fertility rate, reflective of its high standard of living and access to View diagram Aruba Fertility Rate→

Posted in Demographics | Tagged Aruba demographics, Aruba statistics

West Bank and Gaza Fertility Rate

West Bank and Gaza Fertility Rate

This diagram presents West Bank and Gaza Fertility Rate. World Bank is the source of this birth data. Latest births per woman information for West Bank and Gaza. The fertility rate in West Bank and Gaza remains high. Cultural expectations View diagram West Bank and Gaza Fertility Rate→

Posted in Demographics | Tagged West Bank and Gaza statistics

Malaysia Fertility Rate

Malaysia Fertility Rate

The above graph shows Malaysia Fertility Rate. This is according to World Bank birth stats by country. Based on the latest available information for Malaysia. Malaysia’s fertility rate is now below replacement level. Urbanization, career-focused lifestyles, and rising costs of View diagram Malaysia Fertility Rate→

Posted in Demographics | Tagged Malaysia demographics, Malaysia statistics

Post navigation

← Older posts
Newer posts →

Primary Sidebar Widget Area

Top Diagrams

Latest Posts

  • Ways to Make Money Fast Illustration
  • Business Model Framework Sample
  • North America Children Per woman
  • Turkey’s Economy – A $1.6 Trillion Economy That Can’t Shake Inflation
  • Mozambique Economy
  • Bulgaria Inflation
  • Saudi Arabia’s Economy – The Oil Giant Trying to Outgrow Oil
  • Suriname Children Per woman
  • Architecture Diagram for Salesforce Trailhead
  • Switzerland’s Economy – Small Country, Enormous Paycheck
  • Zambia GDP
  • Liechtenstein GDP PPP
  • Turkmenistan Economy
  • Netherlands Economy – European Logistics Hub
  • Somalia Inflation
  • Twitter
Copyright © 2026 Economy GDP. All Rights Reserved.
Theme: Catch Box by Catch Themes
Scroll Up