Gen AI Use Cases Examined
Gen AI Use Cases Examined: When examining generative AI use cases, it becomes clear that this technology is revolutionizing many industries, from automating content creation in media to enhancing drug discovery in healthcare. Use cases in marketing, finance, and retail View diagram Gen AI Use Cases Examined
Morocco GDP per capita
This graph shows Morocco GDP per capita. This is according to World Bank GDP stats by country. Latest GDP per person information for Morocco. Morocco’s GDP per capita in 2024 is projected to be around $4,203 nominally and $10,615 based View diagram Morocco GDP per capita
Cash Flow Diagram Maker Described
Cash Flow Diagram Maker Described: A cash flow diagram maker is a tool used to visually represent the inflow and outflow of money within a business or project. These diagrams typically include cash receipts (income) and cash payments (expenses), organized View diagram Cash Flow Diagram Maker Described
St. Martin (French part) Inflation
This graph shows St. Martin (French part) Inflation. The consumer price statistics are compiled by World Bank. Based on the latest available information for St. Martin (French part). Inflation in St. Martin is affected by European policy trends, import dependency, View diagram St. Martin (French part) Inflation
Africa Eastern and Southern Inflation
This diagram presents Africa Eastern and Southern Inflation. Inflation data is sourced from World Bank. Based on the latest economic data provided for Africa Eastern and Southern. Inflation in Eastern and Southern Africa is mainly caused by currency depreciation, high View diagram Africa Eastern and Southern Inflation
AI Use Cases Illustration
AI Use Cases Illustration: AI use cases illustration refers to visual representations of how artificial intelligence is applied in various industries and functions. These illustrations can depict AI-driven solutions in areas such as customer service (via chatbots), predictive analytics (in View diagram AI Use Cases Illustration
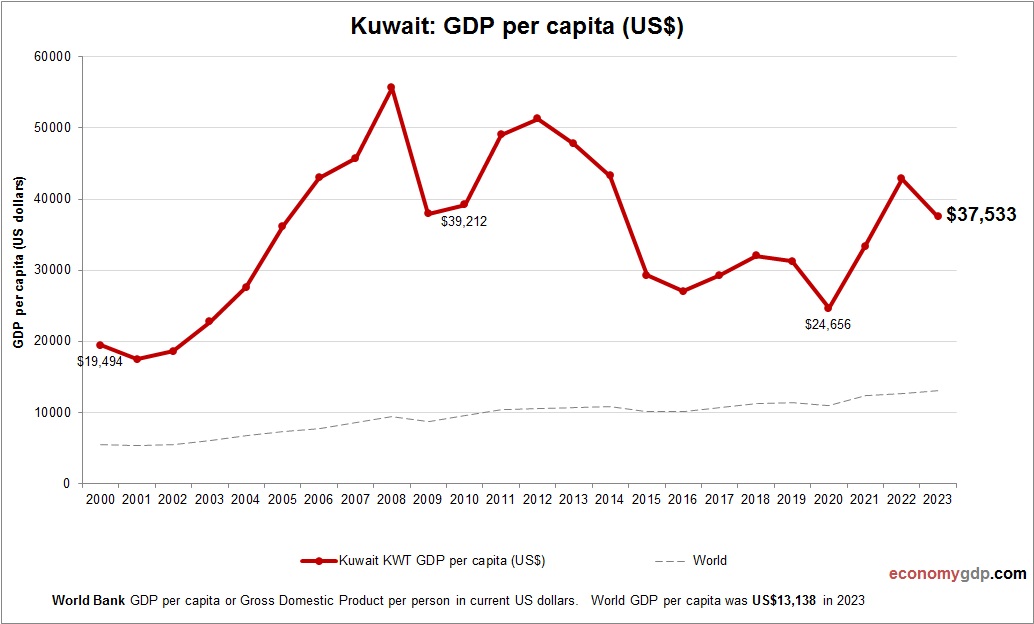
Kuwait GDP per capita
This graph shows Kuwait GDP per capita. The gross domestic product statistics are compiled by World Bank. Latest GDP per person information for Kuwait. Kuwait’s GDP per capita in 2024 is projected to be around $33,000. The economy is heavily View diagram Kuwait GDP per capita
Samoa Inflation
This diagram presents Samoa Inflation. This is according to World Bank consumer price index stats by country. Change in consumer prices for Samoa. Samoas inflation stems from high shipping and import costs, especially for food and fuel. As a small View diagram Samoa Inflation
Salesforce Architecture Diagrams
Salesforce Architecture Diagrams: Salesforce architecture diagrams provide a visual representation of how various Salesforce components and systems interact within an organization. These diagrams typically include key elements such as the Salesforce cloud, external systems, APIs, and the data flow between View diagram Salesforce Architecture Diagrams