Fraud Prevention Implementation Plan

Fraud Prevention Implementation Plan
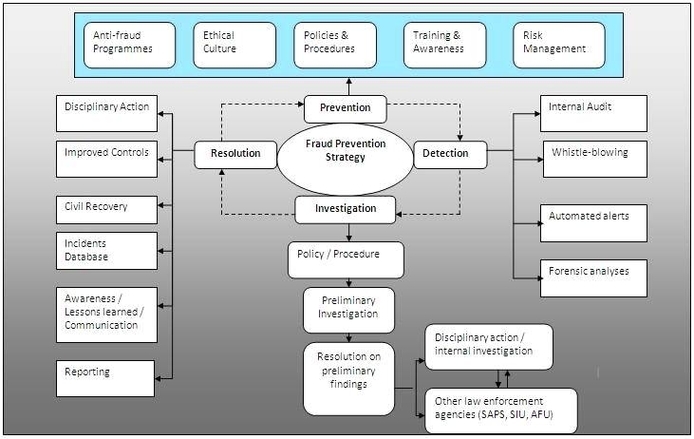
Fraud Prevention Implementation Plan: A fraud prevention implementation plan outlines the steps an organization takes to minimize the risk of fraudulent activities. The plan typically includes strategies such as risk assessments, the use of fraud detection software, employee training, and View diagram Fraud Prevention Implementation Plan→

Business Capabilities Model Graphic

Business Capabilities Model Graphic

Business Capabilities Model Graphic: A Business Capabilities Model graphic is a visual representation of an organization’s key business functions and processes. This graphic typically highlights areas such as operations, customer service, marketing, and sales, and shows how they are interconnected. View diagram Business Capabilities Model Graphic→

Data Analysis Sample Representation

Data Analysis Sample Representation

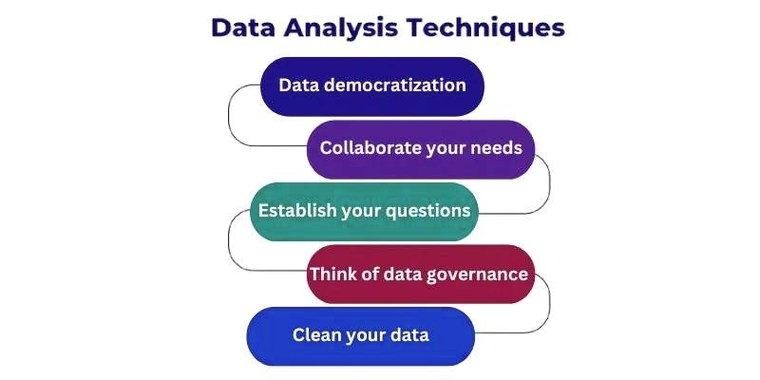
Data Analysis Sample Representation: A data analysis sample representation visually demonstrates how raw data is transformed into meaningful insights through analysis. This might include graphs, charts, and statistical models, helping to clarify trends, correlations, or patterns in the data. Such View diagram Data Analysis Sample Representation→

Ecuador GDP per capita

Ecuador GDP per capita

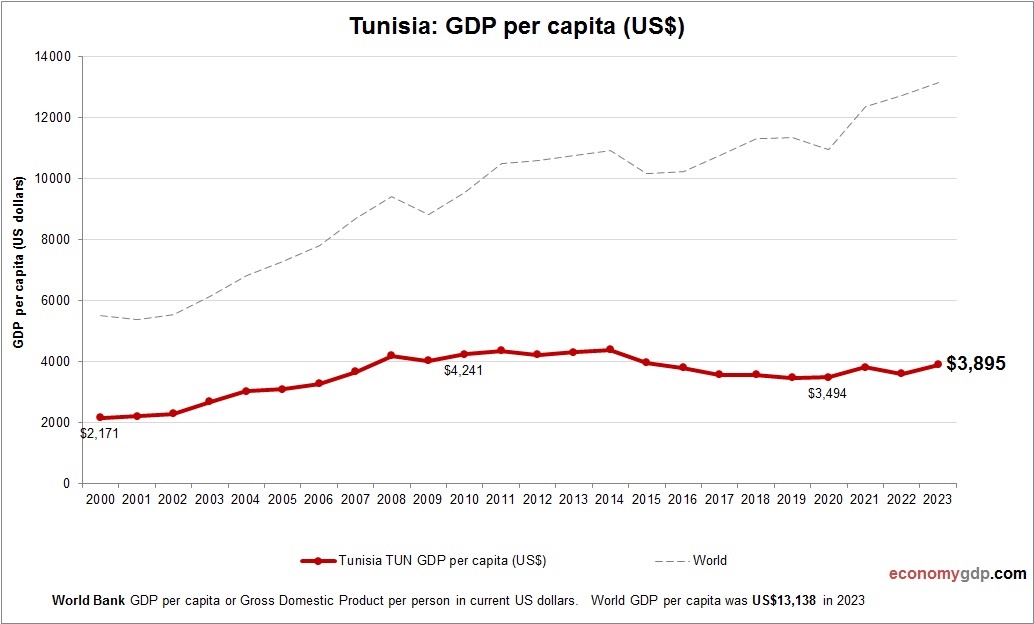
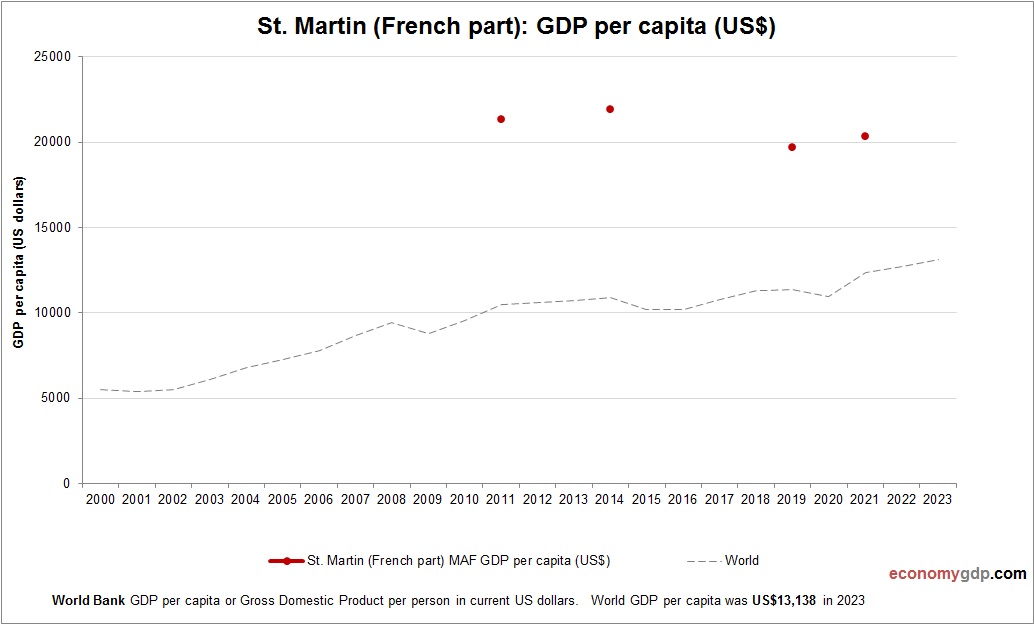
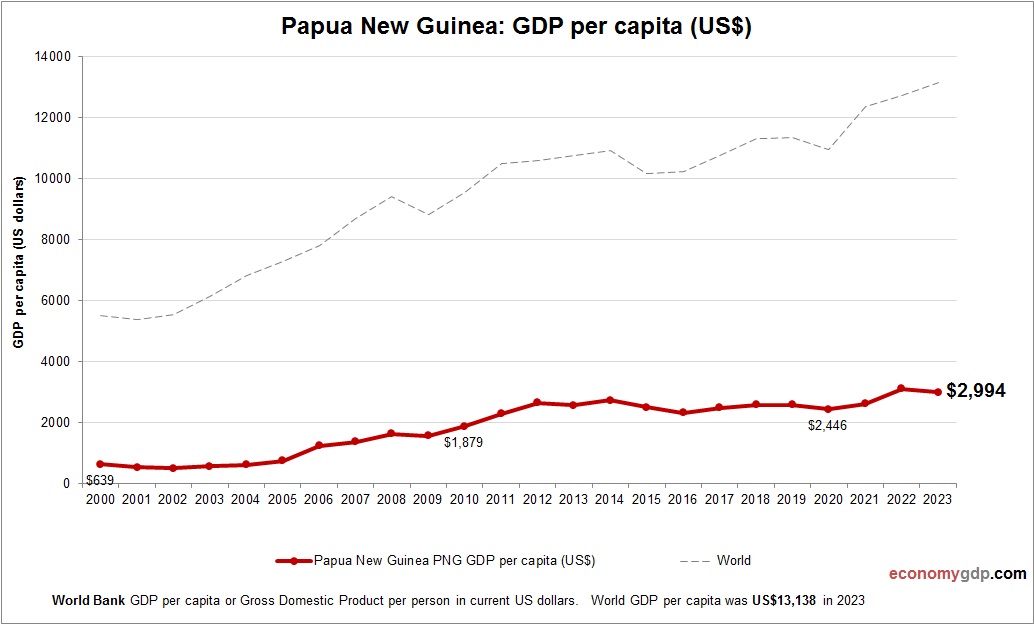
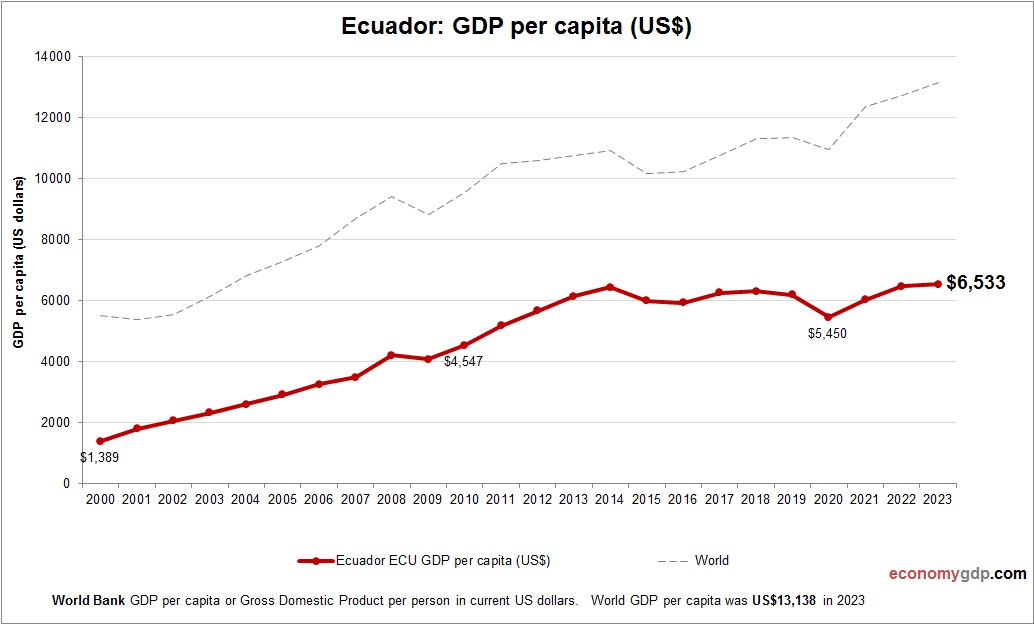
This graph shows Ecuador GDP per capita. The gross domestic product statistics are compiled by World Bank. Based on the latest available information for Ecuador. Ecuador’s GDP per capita has shown gradual improvement, influenced by oil exports, agriculture, and remittances. View diagram Ecuador GDP per capita→