Business Capabilities Model Clarified

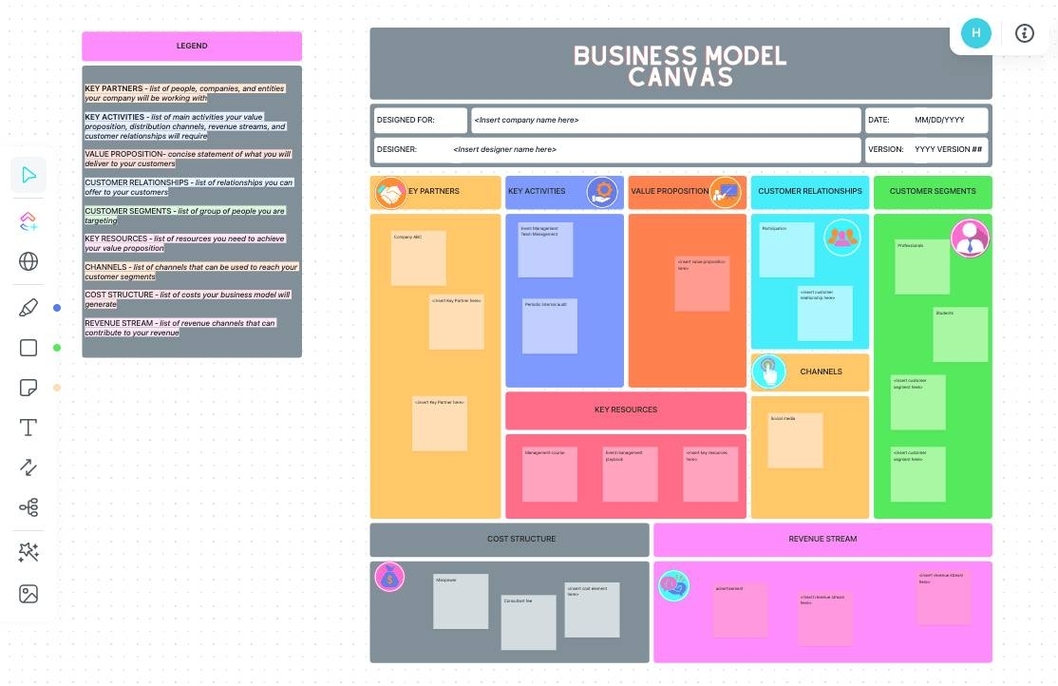
Business Capabilities Model Clarified

Business Capabilities Model Clarified: The business capabilities model clarifies the key functional abilities an organization needs to achieve its strategic goals. It includes core business processes, skills, technologies, and resources. By mapping out these capabilities, organizations can identify gaps, improve View diagram Business Capabilities Model Clarified→

Barbados Inflation

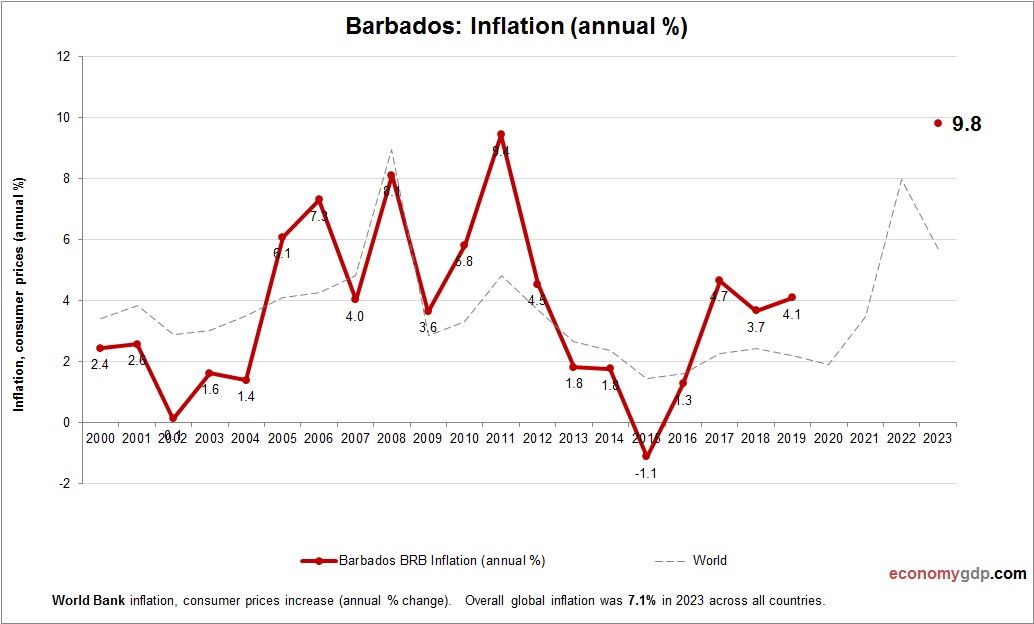
Barbados Inflation

This graph shows Barbados Inflation. Inflation data is sourced from World Bank. Based on the latest available information for Barbados. Barbados experiences inflation largely due to its high reliance on imports for food and energy. Global price increases are quickly View diagram Barbados Inflation→

Jordan GDP per capita

Jordan GDP per capita

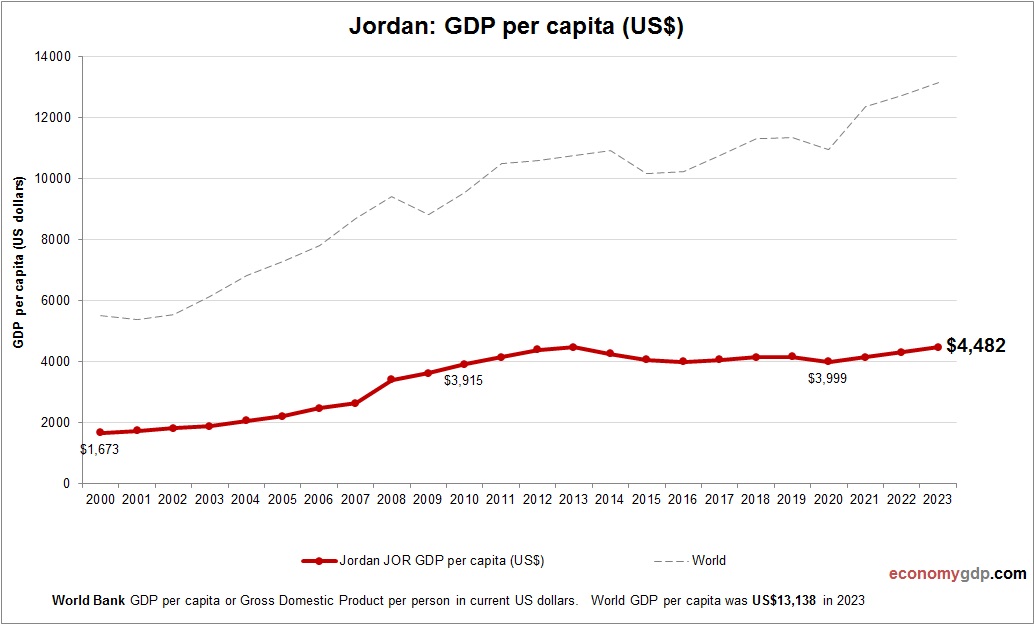
This chart demonstrates Jordan GDP per capita. The economic data is provided by World Bank. Based on the latest economic info provided for Jordan. Jordan’s GDP per capita in 2024 is estimated at approximately $10,917. The economy is characterized by View diagram Jordan GDP per capita→

Data Analysis Sample Illustration

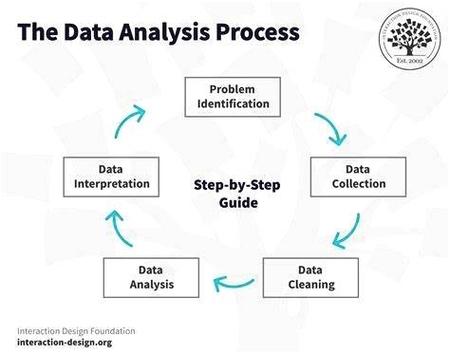
Data Analysis Sample Illustration

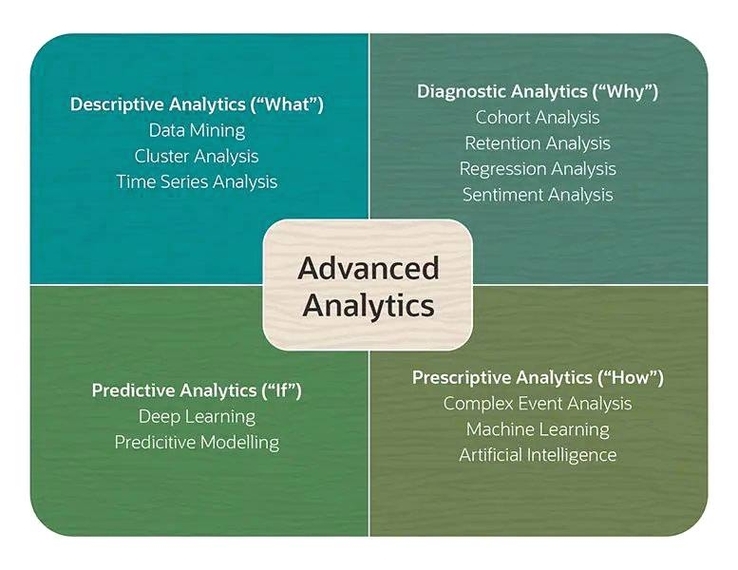
Data Analysis Sample Illustration: A data analysis sample illustration visually demonstrates the process of analyzing data to uncover insights. The illustration might show steps such as data collection, cleaning, analysis, and interpretation, with the results presented in charts or graphs. View diagram Data Analysis Sample Illustration→

Customer Segmentation Graphic Described in Detail

Customer Segmentation Graphic Described in Detail

Customer Segmentation Graphic Described in Detail: A customer segmentation graphic described in detail outlines how a company divides its customer base into smaller, more targeted groups based on attributes such as age, income, or behavior. By using such a graphic, View diagram Customer Segmentation Graphic Described in Detail→