
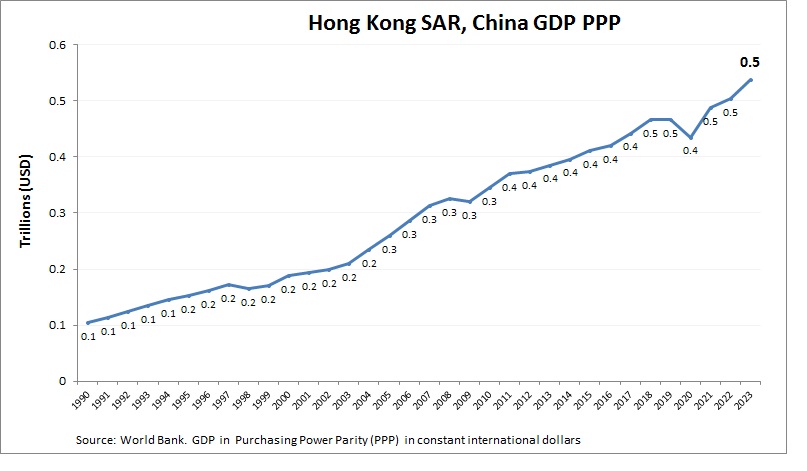
Hong Kong SAR, China economy graph showing purchasing power parity (PPP) growth from 1990 to today. Purchasing power parity adjusts the size of the economy to relevant price levels, i.e. measuring the price of specific goods in different countries and adjusting GDP accordingly.
Hong Kong’s GDP per capita (PPP) in 2023 was approximately $77,940, reflecting its high-income status. The economy is service-oriented, with strengths in finance, trade, logistics, and professional services.
Hong Kong GDP PPP Statistics by Year
| Year | GDP, Purchasing Power Parity (PPP) |
| 2000 | 188.1 |
| 2001 | 193.4 |
| 2002 | 199.7 |
| 2003 | 209.9 |
| 2004 | 234.2 |
| 2005 | 259.4 |
| 2006 | 286.3 |
| 2007 | 313.0 |
| 2008 | 325.8 |
| 2009 | 319.8 |
| 2010 | 345.6 |
| 2011 | 369.7 |
| 2012 | 372.9 |
| 2013 | 384.2 |
| 2014 | 394.1 |
| 2015 | 408.6 |
| 2016 | 416.4 |
| 2017 | 438.1 |
| 2018 | 453.9 |
| 2019 | 459.6 |
| 2020 | 435.3 |
| 2021 | 488.4 |
| 2022 | 504.0 |
| 2023 | 538.9 |
| 2024 | 565.8 |
| 2025 (Est.) | 585.0 |
| 2026 (Est.) | 605.0 |