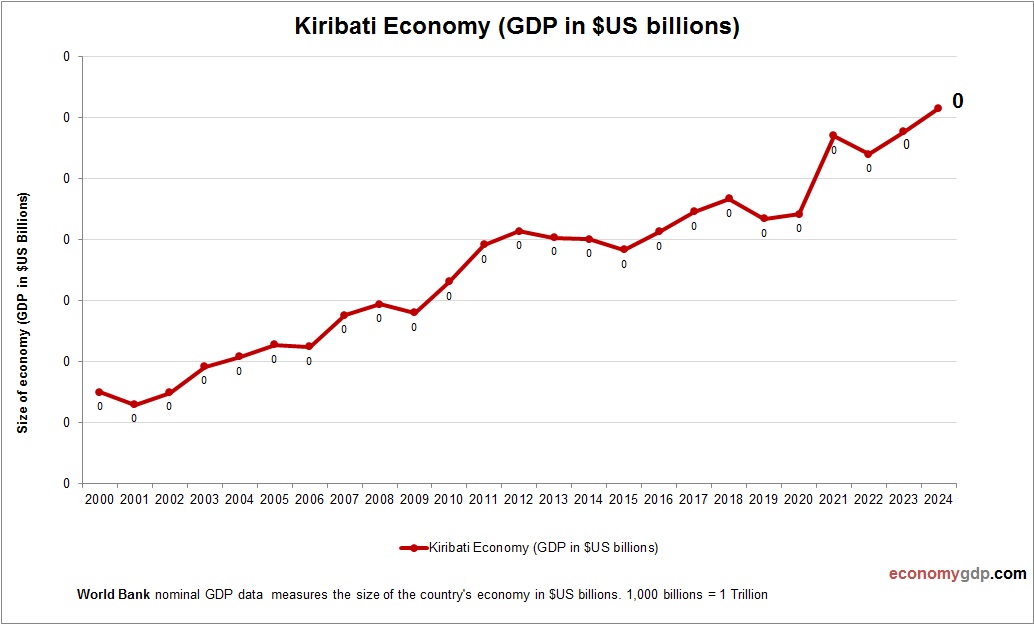
Category Archives: Economy
Hungary GDP Purchasing Power Parity
Hungarys GDP (PPP) is projected at $359.2 billion in 2025. Hungarys economy thrives on manufacturing, services, and agriculture, with automotive and electronics as key sectors. The PPP adjustment boosts GDP due to a moderate cost of living. EU membership drives View diagram Hungary GDP Purchasing Power Parity
Kuwait Economy
East Asia & Pacific GDP per capita
This chart demonstrates East Asia & Pacific GDP per capita. This is according to World Bank GDP stats by country. Based on the latest available information for East Asia & Pacific. The East Asia and Pacific region exhibits a wide View diagram East Asia & Pacific GDP per capita
Middle income GDP per capita
This chart demonstrates Middle income GDP per capita. The economic data is provided by World Bank. Based on the latest available information for Middle income. As of 2024, the World Bank classifies countries with a gross national income (GNI) per View diagram Middle income GDP per capita
Zimbabwe GDP Purchasing Power Parity
Zimbabwes GDP (PPP) is projected at $47.8 billion in 2025. Zimbabwes economy depends on agriculture (tobacco), mining (gold, platinum), and remittances. The PPP adjustment boosts GDP due to a low cost of living. Political instability, hyperinflation, and sanctions have constrained View diagram Zimbabwe GDP Purchasing Power Parity
Mozambique GDP Purchasing Power Parity
Mozambiques GDP (PPP) is estimated at $53.7 billion in 2025. Mozambiques economy relies on agriculture, mining, and natural gas, with recent LNG projects driving growth. The PPP adjustment significantly boosts GDP due to a low cost of living. Conflict in View diagram Mozambique GDP Purchasing Power Parity
Aruba GDP PPP
Arubas PPP GDP was approximately $5.8 billion in 2023. Tourism dominates, contributing over 80% of GDP, with GDP per capita (PPP) around $54,000. Resorts and cruise tourism drive growth, but reliance on global travel markets creates vulnerability. Diversification into renewable View diagram Aruba GDP PPP
Central African Republic Inflation
This diagram presents Central African Republic Inflation. Inflation data is sourced from World Bank. Based on the latest economic data provided for Central African Republic. The Central African Republic suffers from inflation due to conflict, poor infrastructure, and import dependency, View diagram Central African Republic Inflation
