Skip to content
cropped-economygdp.jpg

Economy GDP

World economy charts, business frameworks and diagrams

Menu

Primary menu

  • Economy
    • Top Economies
  • Demographics
  • Business
    • Strategy
    • Project Management
    • Industry Examples
    • Leadership
    • HR
    • Industry Examples
  • Framework
  • Analysis
  • Lean Six Sigma
    • Lean
  • IT
    • Social Media
  • Marketing
  • Stories
  • Top

Category Archives: Economy

Economy, gdp, economic growth diagrams and graphs

Australia Economy in Graphs

Australia Economy in Graphs

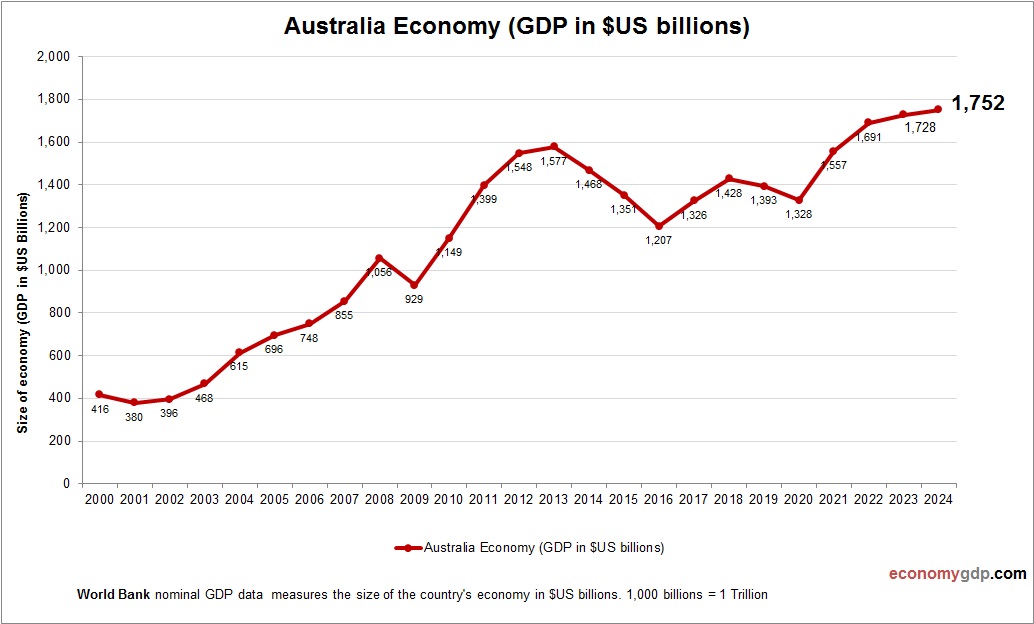
Australia’s economy is driven by mining, agriculture, and services. Iron ore, coal, and natural gas exports dominate, with companies like BHP leading globally. Agriculture, including wheat and beef, is a key contributor. Services, particularly education and tourism, thrive in cities View diagram Australia Economy in Graphs→

Posted in Economy, Top Economies | Tagged Australia economy, Australia gdp

India Economy in Graphs

India Economy in Graphs

India’s economy is diverse, with services, particularly IT and software, leading globally, driven by firms like Infosys and TCS. Agriculture remains a backbone, employing millions in rice, wheat, and textile production. Manufacturing, including pharmaceuticals and textiles, is a top industry, View diagram India Economy in Graphs→

Posted in Economy, Top Economies | Tagged India economy, India gdp

Norway Economy in Graphs

Norway Economy in Graphs

Norway’s economy is dominated by oil, gas, and fisheries. It’s a global leader in petroleum exports, with Equinor driving production. Fisheries, particularly salmon, are a key export. Services, including shipping, also contribute. Emerging industries include renewable energy, with offshore wind View diagram Norway Economy in Graphs→

Posted in Economy, Top Economies | Tagged Norway economy, Norway gdp

United Arab Emirates Economy in Graphs

United Arab Emirates Economy in Graphs

The UAE’s economy is driven by oil, tourism, and finance. Abu Dhabi’s oil exports fuel wealth, while Dubai leads in tourism and trade. Financial services thrive in Dubai’s DIFC. Emerging industries include renewable energy, with solar projects like Noor Abu View diagram United Arab Emirates Economy in Graphs→

Posted in Economy, Top Economies | Tagged United Arab Emirates economy, United Arab Emirates gdp

Belgium Economy in Graphs

Belgium Economy in Graphs

Belgium’s economy is driven by chemicals, logistics, and food processing. It’s a global leader in pharmaceuticals and petrochemicals, with firms like Pfizer. Antwerp’s port makes logistics a top industry, while chocolate and beer exports thrive. Emerging sectors include biotech, focusing View diagram Belgium Economy in Graphs→

Posted in Economy, Top Economies | Tagged Belgium economy, Belgium gdp

European Union Economy in Graphs

European Union Economy in Graphs

The European Union economy is a global powerhouse, driven by diverse industries, services, and trade. Manufacturing, particularly in Germany and France, includes automobiles and machinery, while services dominate in finance and technology. Agriculture and renewable energy are also key. Integration View diagram European Union Economy in Graphs→

Posted in Economy, Top Economies | Tagged European Union economy, European Union gdp

Finland Economy in Graphs

Finland Economy in Graphs

The Finland economy is advanced, driven by technology, manufacturing, and forestry. Companies like Nokia and paper producers lead exports, while renewable energy and gaming industries grow. A strong welfare system and education support stability, but an aging population and high View diagram Finland Economy in Graphs→

Posted in Economy, Top Economies

Egypt Economy in Graphs

Egypt Economy in Graphs

The Egypt economy is driven by tourism, Suez Canal revenues, and agriculture. Historical sites and Red Sea resorts attract visitors, while the canal is a global trade artery. Natural gas exports and remittances are significant, but high population growth, unemployment, View diagram Egypt Economy in Graphs→

Posted in Economy, Top Economies | Tagged Egypt economy, Egypt gdp

Iran Economy in Graphs

Iran Economy in Graphs

The Iran economy is heavily oil-dependent, with petroleum driving exports. Agriculture, including pistachios and saffron, and manufacturing also contribute. Sanctions have constrained growth, causing inflation and unemployment spikes. A large domestic market and skilled workforce offer potential, but political isolation View diagram Iran Economy in Graphs→

Posted in Economy, Top Economies | Tagged Iran economy, Iran gdp

Pakistan Economy in Graphs

Pakistan Economy in Graphs

Pakistan’s economy, worth $350 billion, relies on agriculture, which employs 40% of the workforce and produces cotton, wheat, and rice. Textiles dominate exports, contributing 60% of foreign earnings. The IT sector is emerging, with growing freelancing and tech startups in View diagram Pakistan Economy in Graphs→

Posted in Economy, Top Economies | Tagged Pakistan economy, Pakistan gdp

Post navigation

← Older posts
Newer posts →

Primary Sidebar Widget Area

Top Diagrams

Latest Posts

  • World GDP per capita
  • Honduras GDP
  • Financial Fraud Detection Framework
  • Grenada Fertility Rate
  • Bosnia and Herzegovina Inflation
  • Sudan Economy in Graphs
  • Cash Flow Chart Definition
  • Cameroon Fertility Rate
  • Continuous Improvement Models
  • Chad Economy in Graphs
  • Botswana GDP PPP
  • Cambodia Economy in Graphs
  • Hong Kong GDP
  • Costa Rica GDP per capita
  • Bermuda Economy in Graphs
  • Twitter
Copyright © 2026 Economy GDP. All Rights Reserved.
Theme: Catch Box by Catch Themes
Scroll Up