Belgium Economy in Graphs
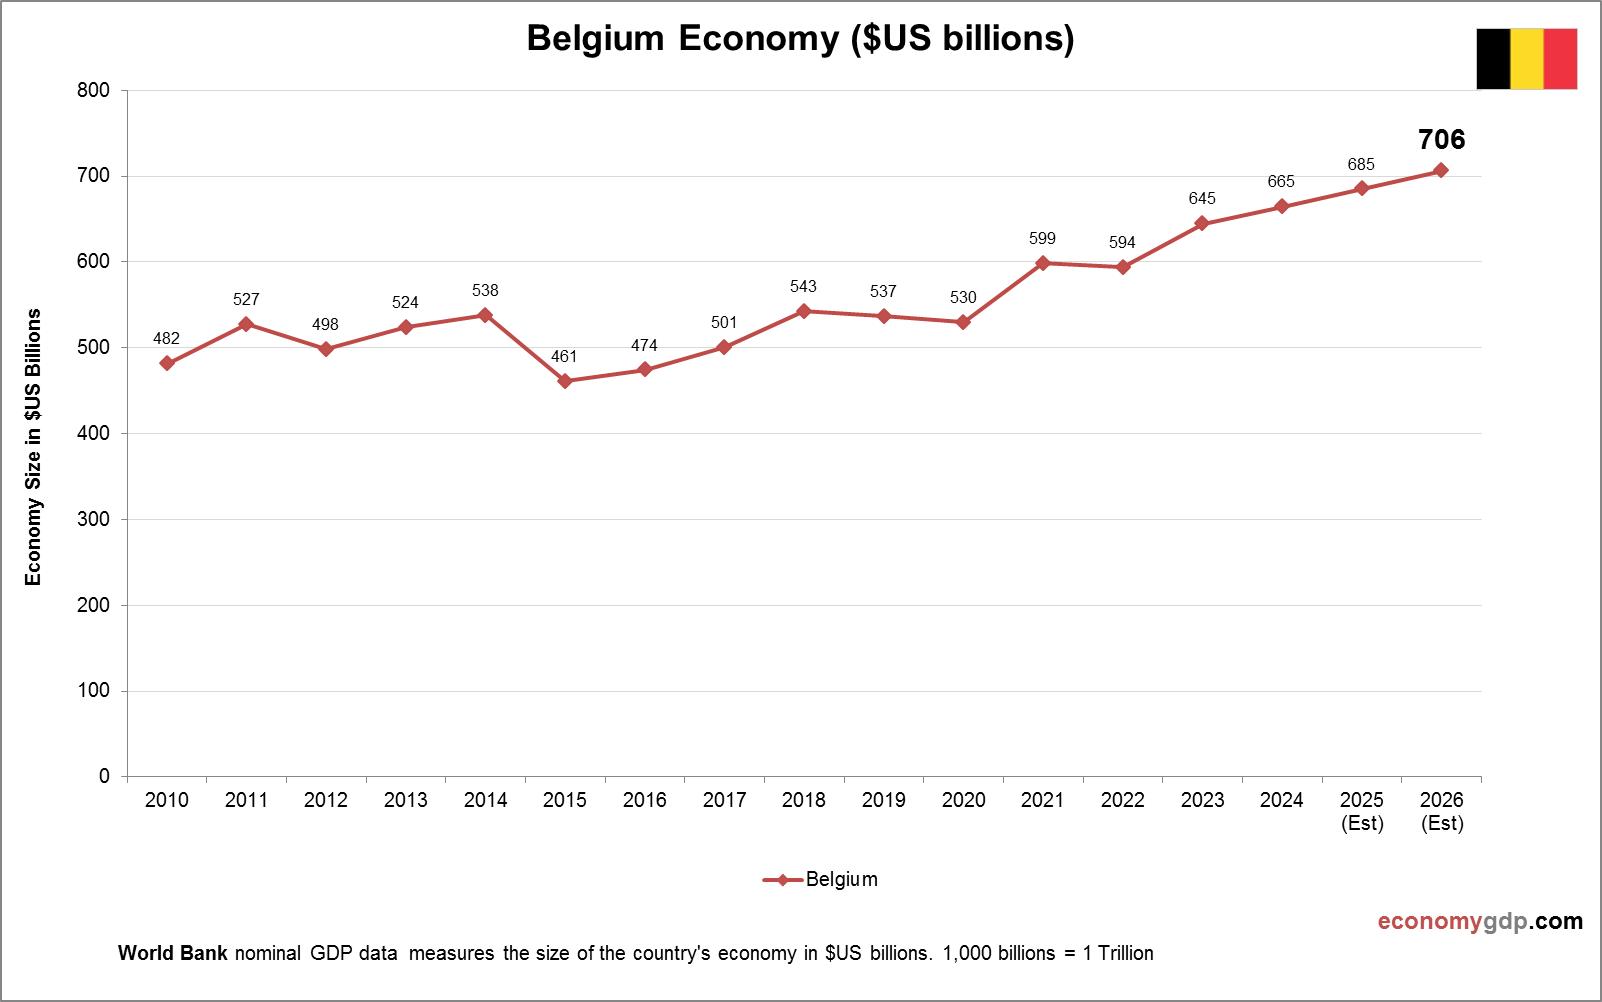
Belgium’s economy is driven by chemicals, logistics, and food processing. It’s a global leader in pharmaceuticals and petrochemicals, with firms like Pfizer. Antwerp’s port makes logistics a top industry, while chocolate and beer exports thrive. Emerging sectors include biotech, focusing View diagram Belgium Economy in Graphs