Skip to content
cropped-economygdp.jpg

Economy GDP

World economy charts, business frameworks and diagrams

Menu

Primary menu

  • Economy
    • Top Economies
  • Demographics
  • Business
    • Strategy
    • Project Management
    • Industry Examples
    • Leadership
    • HR
    • Industry Examples
  • Framework
  • Analysis
  • Lean Six Sigma
    • Lean
  • IT
    • Social Media
  • Marketing
  • Stories
  • Top

Category Archives: Demographics

Greenland Children Per woman

Greenland Children Per woman

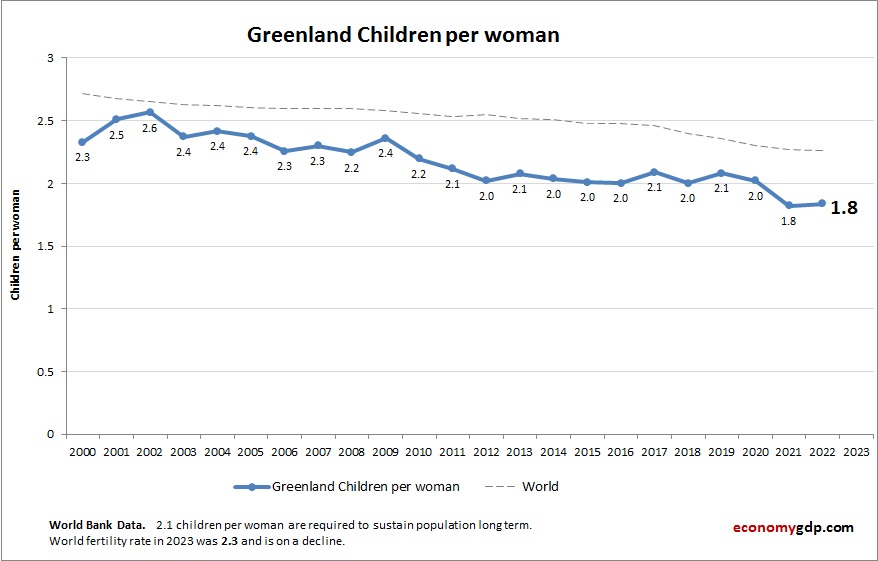
Chart above demonstrates Greenland Children Per woman. The fertility rate statistics are compiled by World Bank. Based on the latest demographics info provided for Greenland. Greenland’s children per woman rate is moderate. Indigenous cultural values and smaller population centers contribute View diagram Greenland Children Per woman→

Posted in Demographics | Tagged Greenland demographics, Greenland statistics

Grenada Fertility Rate

Grenada Fertility Rate

The above graph shows Grenada Fertility Rate. World Bank is the source of this birth data. Based on the latest available information for Grenada. Grenada’s fertility rate is moderate and declining. Urbanization, improved education, and increased awareness of reproductive health View diagram Grenada Fertility Rate→

Posted in Demographics | Tagged Grenada demographics, Grenada statistics

Cameroon Fertility Rate

Cameroon Fertility Rate

The above graph shows Cameroon Fertility Rate. World Bank is the source of this birth data. Based on the latest available information for Cameroon. Cameroon has a moderately high fertility rate, influenced by traditional family norms and improving but still View diagram Cameroon Fertility Rate→

Posted in Demographics | Tagged Cameroon demographics, Cameroon statistics

Albania Fertility Rate

Albania Fertility Rate

This diagram presents Albania Fertility Rate. World Bank is the source of this birth data. Based on the latest demographics info provided for Albania. Albania’s fertility rate is low. Emigration and changing societal norms contribute to fewer children per woman View diagram Albania Fertility Rate→

Posted in Demographics | Tagged Albania demographics, Albania statistics

Philippines Fertility Rate

Philippines Fertility Rate

Chart above demonstrates Philippines Fertility Rate. The fertility rate statistics are compiled by World Bank. Based on the latest demographics info provided for Philippines. The Philippines has a moderate fertility rate, gradually declining with family planning expansion. See detailed Philippines View diagram Philippines Fertility Rate→

Posted in Demographics | Tagged Philippines demographics, Philippines statistics

Saudi Arabia Fertility Rate

Saudi Arabia Fertility Rate

The above graph shows Saudi Arabia Fertility Rate. This is according to World Bank birth stats by country. Based on the latest available information for Saudi Arabia. Saudi Arabia’s fertility rate is moderate and declining due to urbanization and family View diagram Saudi Arabia Fertility Rate→

Posted in Demographics | Tagged Saudi Arabia demographics, Saudi Arabia statistics

Upper middle income Fertility Rate

Upper middle income Fertility Rate

This diagram presents Upper middle income Fertility Rate. This is according to World Bank birth stats by country. Based on the latest demographics info provided for Upper middle income. Countries classified as upper middle income generally experience declining fertility rates View diagram Upper middle income Fertility Rate→

Posted in Demographics

Rwanda Fertility Rate

Rwanda Fertility Rate

This diagram presents Rwanda Fertility Rate. This is according to World Bank birth stats by country. Based on the latest available information for Rwanda. Rwanda has seen a significant drop in fertility rate, thanks to strong government policies promoting family View diagram Rwanda Fertility Rate→

Posted in Demographics | Tagged Rwanda demographics, Rwanda statistics

South Korea Fertility Rate

South Korea Fertility Rate

This diagram presents South Korea Fertility Rate. World Bank is the source of this birth data. Latest births per woman information for South Korea. South Korea has the lowest fertility rate in the world. A mix of high housing and View diagram South Korea Fertility Rate→

Posted in Demographics | Tagged South Korea demographics, South Korea statistics

Slovenia Fertility Rate

Slovenia Fertility Rate

Chart above demonstrates Slovenia Fertility Rate. The fertility rate statistics are compiled by World Bank. Latest births per woman information for Slovenia. Slovenia has a low fertility rate. Despite strong social services, modern European lifestyles and economic concerns continue to View diagram Slovenia Fertility Rate→

Posted in Demographics | Tagged Slovenia demographics, Slovenia statistics

Post navigation

← Older posts
Newer posts →

Primary Sidebar Widget Area

Top Diagrams

Latest Posts

  • Malaysia Children Per woman
  • Greece Inflation
  • Dominican Republic Fertility Rate
  • Montenegro Children Per woman
  • Tanzania GDP PPP
  • Tunisia GDP PPP
  • Kosovo GDP
  • Process Improvement Project
  • Mali GDP Purchasing Power Parity
  • Four Data Analysis Techniques
  • Honduras Economy
  • Fiji Fertility Rate
  • Sri Lanka GDP
  • Greece Economy
  • Slovenia GDP PPP
  • Twitter
Copyright © 2026 Economy GDP. All Rights Reserved.
Theme: Catch Box by Catch Themes
Scroll Up