
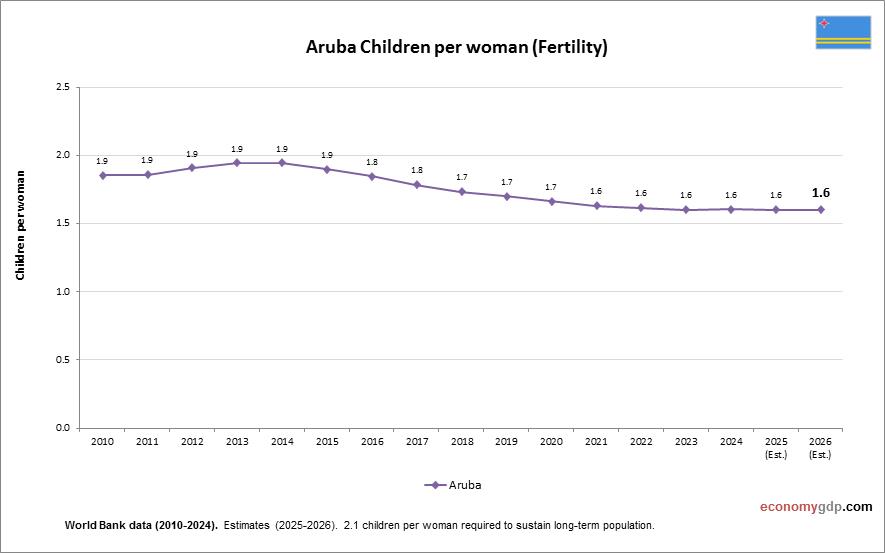
The above graph shows Aruba Children Per woman. The fertility rate statistics are compiled by World Bank. Based on the latest available information for Aruba.
Aruba has a low children per woman rate. As a high-income island territory, it follows broader demographic trends of delayed parenthood and smaller families.
Aruba Children Per woman (Fertility Rate) Statistics by Year
| Year | Children per woman (fertility rate) |
| 2000 | 1.85 |
| 2001 | 1.81 |
| 2002 | 1.80 |
| 2003 | 1.81 |
| 2004 | 1.82 |
| 2005 | 1.84 |
| 2006 | 1.86 |
| 2007 | 1.88 |
| 2008 | 1.89 |
| 2009 | 1.88 |
| 2010 | 1.86 |
| 2011 | 1.86 |
| 2012 | 1.91 |
| 2013 | 1.94 |
| 2014 | 1.94 |
| 2015 | 1.90 |
| 2016 | 1.85 |
| 2017 | 1.79 |
| 2018 | 1.73 |
| 2019 | 1.70 |
| 2020 | 1.66 |
| 2021 | 1.63 |
| 2022 | 1.62 |
| 2023 | 1.60 |
| 2024 | 1.61 |
| 2025 (Est.) | 1.60 |
| 2026 (Est.) | 1.60 |