
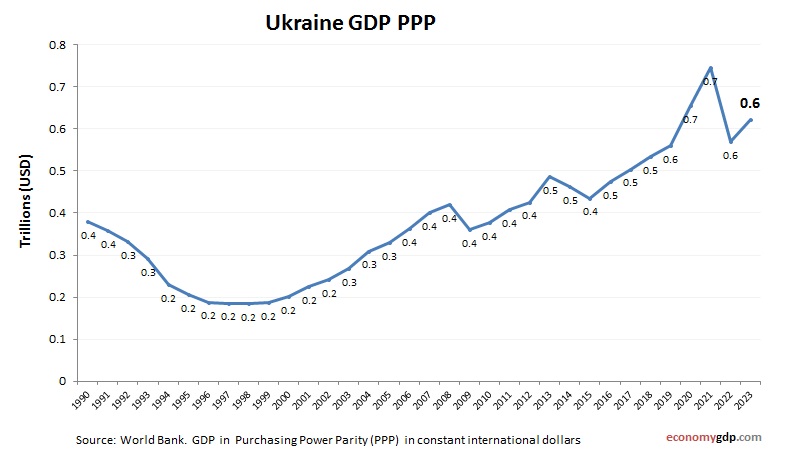
Ukraine economy graph showing purchasing power parity (PPP) growth from 1990 to today. Purchasing power parity adjusts the size of the economy to relevant price levels, i.e. measuring the price of specific goods in different countries and adjusting GDP accordingly.
In 2023, Ukraine’s GDP per capita (PPP) was around $15,885, approximately 89% of the global average, reflecting its transitional economy amidst ongoing challenges. Ukraines economy is largely based on agriculture, metallurgy, and energy resources.
Ukraine GDP PPP Statistics by Year
| Year | GDP, Purchasing Power Parity (PPP) |
| 2000 | 209.5 |
| 2001 | 233.1 |
| 2002 | 249.4 |
| 2003 | 278.5 |
| 2004 | 319.7 |
| 2005 | 339.9 |
| 2006 | 376.9 |
| 2007 | 418.9 |
| 2008 | 436.5 |
| 2009 | 372.7 |
| 2010 | 392.7 |
| 2011 | 422.6 |
| 2012 | 441.4 |
| 2013 | 503.0 |
| 2014 | 458.6 |
| 2015 | 431.2 |
| 2016 | 469.9 |
| 2017 | 496.5 |
| 2018 | 537.2 |
| 2019 | 604.4 |
| 2020 | 656.1 |
| 2021 | 746.5 |
| 2022 | 569.7 |
| 2023 | 622.9 |
| 2024 | 656.5 |
| 2025 (Est.) | 690.0 |
| 2026 (Est.) | 730.0 |