
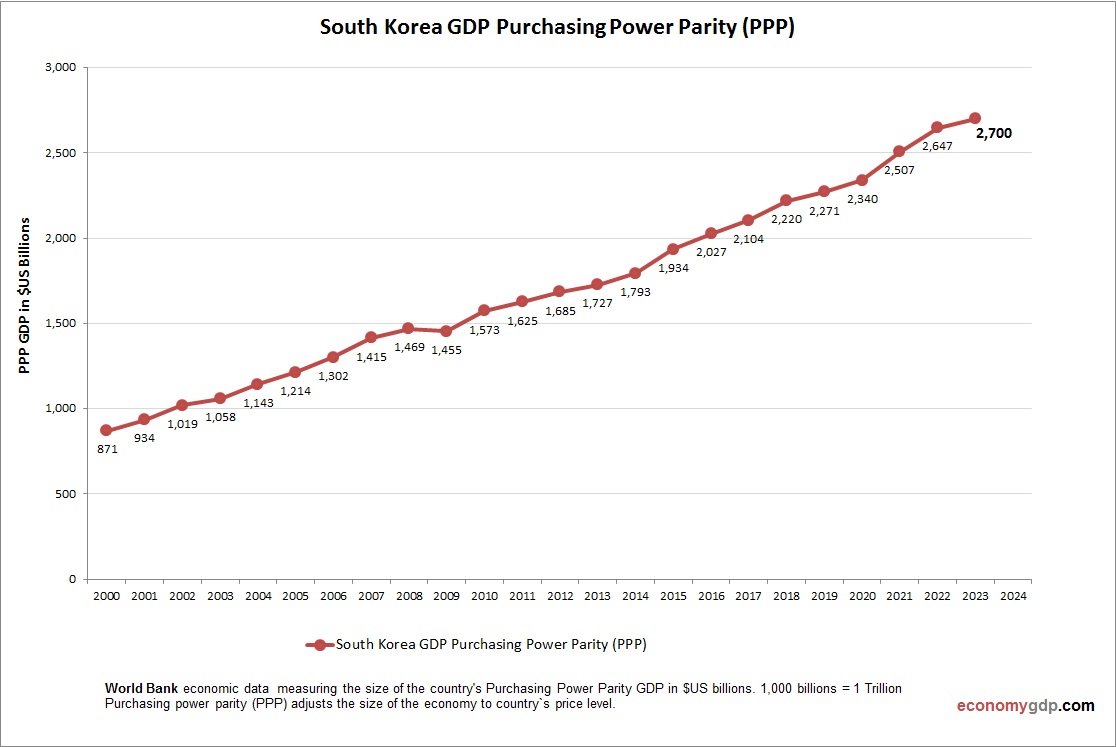
South Korea economy graph showing purchasing power parity (PPP) growth from 2000 to today. Purchasing power parity adjusts the size of the economy to relevant price levels, i.e. measuring the price of specific goods in different countries and adjusting GDP accordingly.
South Korea’s GDP per capita (PPP) in 2023 was about $50,572, indicating a highly developed economy. Key industries include electronics, automotive, shipbuilding, and petrochemicals.
South Korea GDP PPP Statistics by Year
| Year | GDP, Purchasing Power Parity (PPP) |
| 2000 | 904.3 |
| 2001 | 968.4 |
| 2002 | 1,056.4 |
| 2003 | 1,097.7 |
| 2004 | 1,185.6 |
| 2005 | 1,261.4 |
| 2006 | 1,354.9 |
| 2007 | 1,472.9 |
| 2008 | 1,531.0 |
| 2009 | 1,515.7 |
| 2010 | 1,641.2 |
| 2011 | 1,695.1 |
| 2012 | 1,760.1 |
| 2013 | 1,807.6 |
| 2014 | 1,879.3 |
| 2015 | 2,030.1 |
| 2016 | 2,134.4 |
| 2017 | 2,216.6 |
| 2018 | 2,347.7 |
| 2019 | 2,407.6 |
| 2020 | 2,482.0 |
| 2021 | 2,677.4 |
| 2022 | 2,868.3 |
| 2023 | 2,969.8 |
| 2024 | 3,159.5 |
| 2025 (Est.) | 3,300.0 |
| 2026 (Est.) | 3,450.0 |