
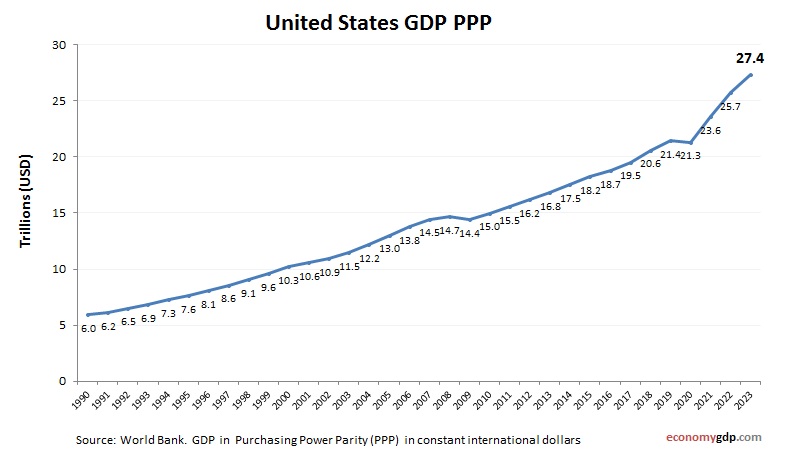
United States economy graph showing purchasing power parity (PPP) growth from 1990 to today. Purchasing power parity adjusts the size of the economy to relevant price levels, i.e. measuring the price of specific goods in different countries and adjusting GDP accordingly.
The United States recorded a GDP per capita (PPP) of approximately $73,637 in 2023, equating to about 415% of the global average, underscoring its position as a leading global economy. The U.S. economy is diverse, with major outputs in technology, finance, healthcare, energy, and agriculture.