
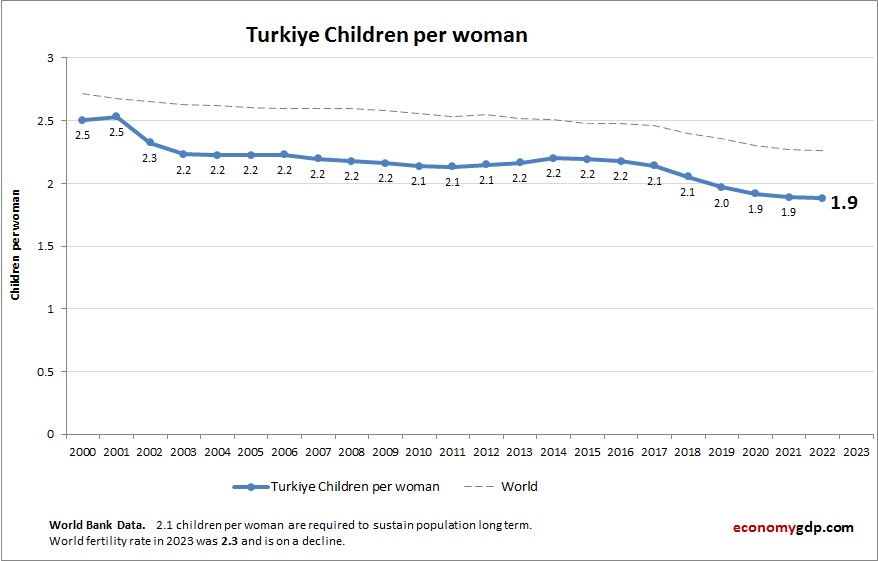
This diagram show Turkey children per woman. The fertility rate statistics are compiled by Worldbank based on the latest demographics stats.
Turkiye Children Per woman (Fertility Rate) Statistics by Year
| Year | Children per woman (fertility rate) |
| 2000 | 2.49 |
| 2001 | 2.39 |
| 2002 | 2.27 |
| 2003 | 2.20 |
| 2004 | 2.20 |
| 2005 | 2.20 |
| 2006 | 2.19 |
| 2007 | 2.16 |
| 2008 | 2.15 |
| 2009 | 2.10 |
| 2010 | 2.08 |
| 2011 | 2.05 |
| 2012 | 2.11 |
| 2013 | 2.11 |
| 2014 | 2.19 |
| 2015 | 2.16 |
| 2016 | 2.11 |
| 2017 | 2.08 |
| 2018 | 2.0 |
| 2019 | 1.89 |
| 2020 | 1.77 |
| 2021 | 1.71 |
| 2022 | 1.63 |
| 2023 | 1.51 |
| 2024 | 1.48 |
| 2025 (Est.) | 1.47 |
| 2026 (Est.) | 1.46 |